
Falling Interest Rates and Government Investment
Switzerland is an amazing place, not least the skiing, the chocolate, and the punctual trains. The latter is part of the country’s exquisitely maintained infrastructure: there are no potholes, and no deferred maintenance of train tracks, tunnels, airports, or public buildings. Few countries go so far, but many can take a lesson: it pays to maintain infrastructure at least so that it doesn’t fail.
We bring this up now because financial markets are telling us that it’s a very good time to build and repair infrastructure: real (inflation-adjusted) interest rates have fallen so low that it has become exceptionally cheap to finance the improvement and repair of neglected roads, bridges, transport hubs, and public utilities. Yet, in the United States, we are doing less public investment than ever: net government investment has fallen to what is probably a record low.
To see what’s happening to the trend of public funding costs, we try to remove cyclical fluctuations (which also removes the impact of most monetary policy actions) by looking at forward interest rates. Using the yield curve for both nominal and inflation-indexed Treasury bonds, a group of Federal Reserve economists have computed the “five-year forward five-year interest rate.” One way to understand this as the interest rate that you would see today in a contract to buy a five-year bond in five years.
The following chart shows the five-year forward five-year real interest rate and the break-even inflation starting in 1999 (the start of the period when there are enough inflation-indexed Treasury bonds to do the computation). Over that period, the real interest rate has fallen from around 4% to near 1%.
Five-year forward five-year real interest rate and break-even inflation (end-of-month observations), 1999 to 2015.

Financial markets are global, so it would be very strange if this decline in real interest rates were just a local U.S. phenomenon. That is, because capital can flow easily across borders—especially those of advanced economies—risk-free real interest rates tend to move together everywhere in the world. And, as a recent Bank of England working paper shows, they have. That study shows that world 10-year real interest rates have fallen by 450 basis points since 1990.
As the Bank of England paper describes in detail, the decline is the product of a variety of forces. The authors cite lower growth expectations, demographic factors, higher inequality, increased reserve holdings, changes in investment opportunities, and increased risk premia as the primary sources of the fall. That long list allows them to account for 90% of the decline.
Many readers will know that the drop in real interest rates and the forces driving it are central to the debate over secular stagnation, which we summarize in an earlier post. But it is important for other reasons as well. For example, if the equilibrium real interest rate is lower, that means that the equilibrium nominal interest rate will be lower, too. This, in turn, raises the probability that monetary policy will hit the zero lower bound for nominal interest rates again in the future, and is therefore an argument for raising the inflation objective. (See our earlier discussion of the 2% target that is pervasive in the advanced world.)
Yet another implication of the fall in the risk-free real interest rate is that it increases the number of projects—public or private—that meet the financing cost-benefit test. That is, when the government borrowing cost is 1% (real) rather than 2%, it is much cheaper to both build and maintain public goods, including large-scale transportation and utility projects. So, even if this physical capital were not deteriorating, this would seem to be a good time for modernization and enhancement.
So, where does U.S. government investment stand today? To get a sense of the scale involved, let’s start with the existing capital stock of the government—federal, state and local. The Bureau of Economic Analysis estimates this at about $13 trillion, or more than 70% of GDP. Gross government investment is currently running something like $600 billion, which is less than 5% of the capital stock. Subtracting depreciation, we can compute net government investment as a share of net domestic product (NDP), which fell to 0.5% in 2014, the lowest on record. The following chart shows how this ratio evolved over the past half century. For government assets to remain proportional to the size of the economy, this number would have to stay roughly constant—which it did for most of the period between 1970 and 2010.
Net Government Investment as a percentage of Net Domestic Product (annual data), 1959-2014
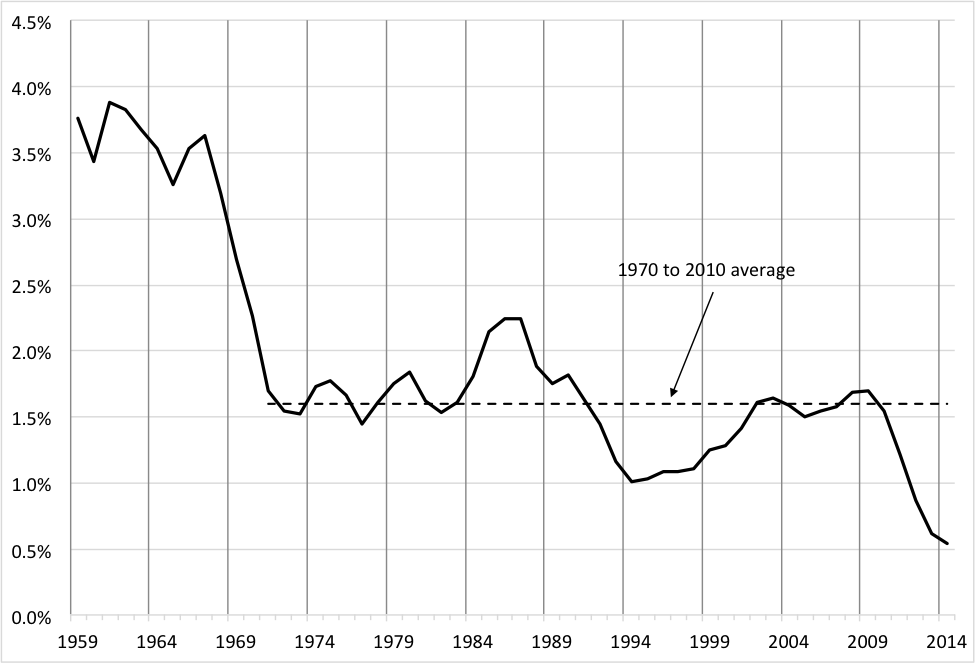
Source: FRED. Note: Net domestic product is GDP less depreciation.
Taking these numbers at face value, the implication is that net government investment is basically disappearing. For the federal government, net investment is currently below $10 billion and for state and local governments, it is below $100 billion. Given that the federal government's own estimates put deferred maintenance of infrastructure at something like $150 billion, this is all extremely troubling.
Fixing the problem would be straightforward, and cheap in terms of finance. Restoring the ratio of net investment to net national product back to the 1.6% average that prevailed from 1970 to 2010 would require an increase of about 1% of NDP, or roughly $150 billion per year. (Making up the large shortfall since 2010 would require catch-up investment of between 5 and 6 times that amount.) From a financial perspective, this increase would add only modestly to the general government debt (the sum of federal, state and local), which is currently about $18 trillion (a bit over 100% of GDP). Indeed, if the real return to the investment is 1% or more—matching or exceeding the real financing cost—the increase in infrastructure outlays would leave the government’s debt-to-GDP ratio stable or declining. (As is argued here, in a depressed economy, increased investment could even be self-financing.)
To be clear, this argument need not be seen as one for a larger government, but for an efficient one that provides the public goods necessary for sustained economic growth at the lowest cost. For a country to remain prosperous, it needs an infrastructure that is constantly being renewed and improved. The alternative of postponing maintenance probably leads to higher costs—both from the direct impact on the economy from the deterioration of physical capital and from the need to finance future (larger) repair projects at potentially higher interest rates. Put differently, when fiscal policymakers choose to tighten the nation’s belt, they should not do so at the expense of future national income.
A trip from any major U.S. airport to one in Asia (forget Switzerland!) is enough to make the point. A traveller leaves from a dilapidated building and arrives to find a new sparkling structure. More important from an economic perspective, the same is true for the roads, bridges, tunnels, and (where they exist at all in the United States) rail connections on the way to the U.S. airport and from the one in Asia.
There is no need to be as obsessive as the Swiss; their outlays for public goods are surely greater than most Americans would wish to pay. But given today’s low hurdle rate of return, it is difficult to see how spending an extra 1% of NDP each year now to maintain and improve roads, bridges, airports, and buildings would be economically unsound. Even if the additional outlays are not self-financing, the social return is likely to be far greater than the cost. As monetary economists, we include as a valuable social benefit the reduced probability of hitting the zero lower bound in a world with a 2% inflation target.