
Liquidity Regulation
Ever since Bagehot, central banks acting as lenders of last resort have tried to distinguish banks that are illiquid, who should be eligible for a loan, from banks that are insolvent, who should not. The challenge persists. As one analyst put it recently: “Liquidity and solvency are the heavenly twins of banking, frequently indistinguishable. An illiquid bank can rapidly become insolvent, and an insolvent bank illiquid.” The lesson is that the appropriate level of a bank’s capital and the liquidity of its assets are necessarily related.
Forged in the crucible of the financial crisis, Basel III took this lesson to heart, creating a new regime for liquidity regulation to supplement the capital rules that were originally developed 30 years before.
Technically, the liquidity requirement has two parts: the liquidity coverage ratio (LCR) and the net stable funding ratio (NSFR). When added to the capital requirement, these collectively address the incentives that banks have to be too leveraged, to hold too few liquid assets, and to engage in too much maturity transformation. (The Basel Committee’s final definition of the LCR is here, and their current description of the NSFR here.)
This month, U.S. authorities released final rules for implementing the LCR, which is the subject of this post. The goal of the LCR is to ensure that a sufficient fraction of banks’ assets can be easily converted into cash, constraining the degree to which banks can use liquid liabilities to finance illiquid assets in a way that is very similar to a traditional reserve requirement. The idea is that these “high-quality liquid assets” can be used to meet deposit outflows and contingent lending obligations without relying on a fire sale of bank assets – something that has a negative impact on everyone else – or on borrowing from the lender of last resort, the central bank.
Why has it taken policymakers so long to implement the LCR? Following the Basel III package in 2010, the biggest debates were over what constitutes a high-quality liquid asset. Should it be just government bonds? Do corporate bonds count? How about access to the central bank’s discount window lending?
In Europe, for example, some authorities felt that banks should be allowed to count all of the assets that are eligible to be used as collateral in borrowing from the central bank as high quality and liquid. One of us who was involved in these negotiations strongly disagreed because many of these assets are highly illiquid. In the United States, for example, even a bank’s buildings and furniture can be used as collateral for a loan from the Federal Reserve. Allowing these to count as liquid would make the LCR meaningless, turning the central bank into the lender of first resort rather than the lender of last resort.
Australia poses a more interesting case. Australian regulators wanted an LCR with teeth, one where high-quality liquid assets really are securities for which there was always a market. In countries with healthy sovereigns like Australia, that usually means government bonds. But Australia’s government debt is relatively small. In fact, officials estimated that the LCR would require banks to hold a volume of liquid assets equal to nearly double the outstanding government debt! The solution has been for the central bank to create a committed liquidity facility (for a fee) that counts as a liquid asset for the bank. (You can find a detailed description of the mechanics here.)
Returning to the United States, a key bone of contention has been the status of municipal bonds. Issued by state and local governments, these are used to finance things like roads, schools and sewer systems. And, they are generally exempt from income tax.
Issuers and current investors naturally wanted muni’s to be counted. Doing so would raise demand for these securities and support their price. How should we think about this?
Well, the simplest thing to do is to ask whether municipal bonds are in fact liquid. If you own one, how hard is it to sell? To see we can look at the size and volume of trading in these markets. First, the size (see top panel below). According to the Securities Industry and Financial Markets Association (SIFMA), as of 2013, there are $3.7 trillion worth of municipal bonds out there. By comparison, there are nearly $10 trillion in corporate bonds, $14 trillion in U.S. Treasury and Federal Agency securities, and nearly $9 trillion in mortgage-backed securities (MBS). So, overall municipal bonds are a bit less than 10% of the total.
Quantities per se are not really relevant for liquidity. Trading frequency is. SIFMA publishes data on average daily trading volume in U.S. bond markets. From this, we can measure the fraction of the outstanding bonds that are traded on an average day (see the plot in the bottom panel below). For everything except for U.S. Treasury bonds and MBS backed by the U.S. federal government, the numbers are miniscule. Municipal bond daily turnover averages 0.31% of stock outstanding; corporate bonds average an even lower 0.19% per day. In other words, these are not liquid securities. They rarely trade, so they are difficult to sell.
In the end, the proponents of including municipal bonds in the list of eligible assets for meeting the LCR lost the fight. Our view is that this was the right outcome: the U.S. implementation of the LCR passes this basic smell test.
But how effective will the U.S. LCR be in preventing or mitigating banking panics? In light of the close interaction between bank liquidity and capitalization, much will depend on how capital requirements evolve, and on how regulators implement the stress tests for both liquidity and capital. Fortunately, the Federal Reserve appears intent on raising capital requirements for global systemic intermediaries above the levels implied by the Basel Committee framework, taking into account each bank’s reliance on volatile short-term funding. Nevertheless, uncertainties about the changing regulatory regime will probably keep the jury out for years to come.
U.S. Bonds: Quantities Outstanding (trillions of dollars) and Avg. Daily Turnover (Percent of Outstanding)
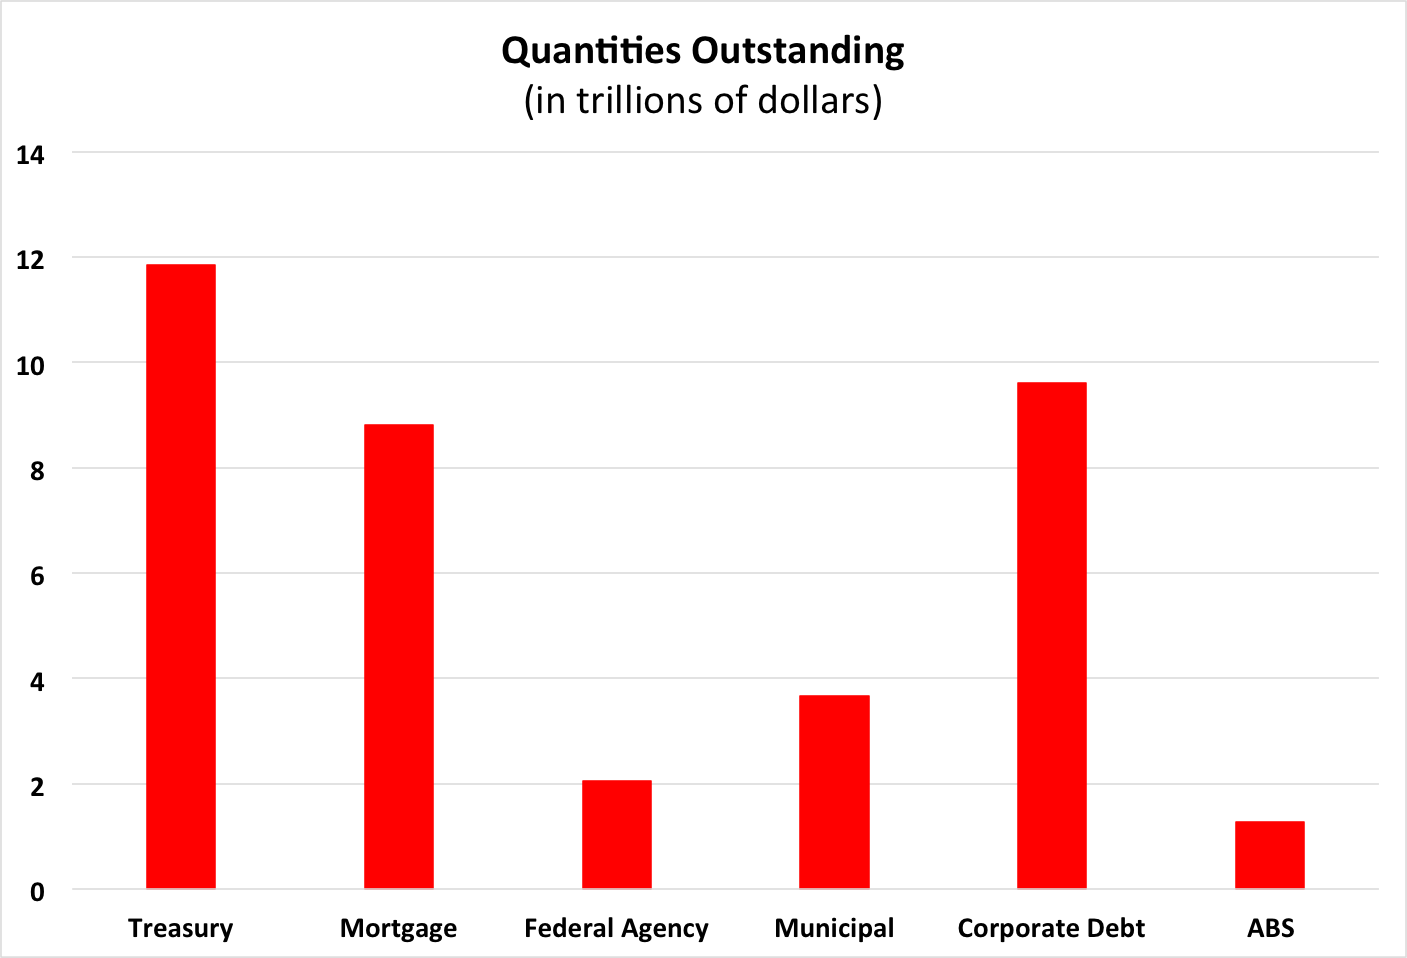

Source: SIFMA and authors’ calculations.
Note: This version was modified slightly on the day of the initial post.