
Treasury Round II: The Capital Markets Report
Earlier this month, the U.S. Treasury published the second of four planned reports designed to implement the core principles for regulating the U.S. financial system announced in President Trump’s February 2017 Executive Order. This report focuses on capital markets. We wrote about the first report—regarding depository institutions—in June (see here). Future reports are slated to address “the asset management and insurance industries, and retail and institutional investment products and vehicles” and “nonbank financial institutions, financial technology, and financial innovation.”
A central motivation for all this work is to review the extensive regulatory reforms enacted in the aftermath of the 2007-09 financial crisis. President Trump’s stated principles provide an attractive basis for evaluating the effectiveness of Dodd-Frank in making the financial system both more cost-effective and safer. Where have the reforms gone too far? Where have they not gone far enough?
Much of the capital markets report focuses on ways to reduce the regulatory burden, and many of the proposals—which address issues ranging from initial public offerings (IPOs) to securitizations to financial market utilities (FMUs)—could improve market function. However, while they would involve a large number of changes—most of which can be implemented without new legislation (see table)—none of the 100-plus recommendations seem terribly dramatic, nor are they likely to have much impact on the goal of promoting economic growth.
Treasury recommendations with regard to capital markets
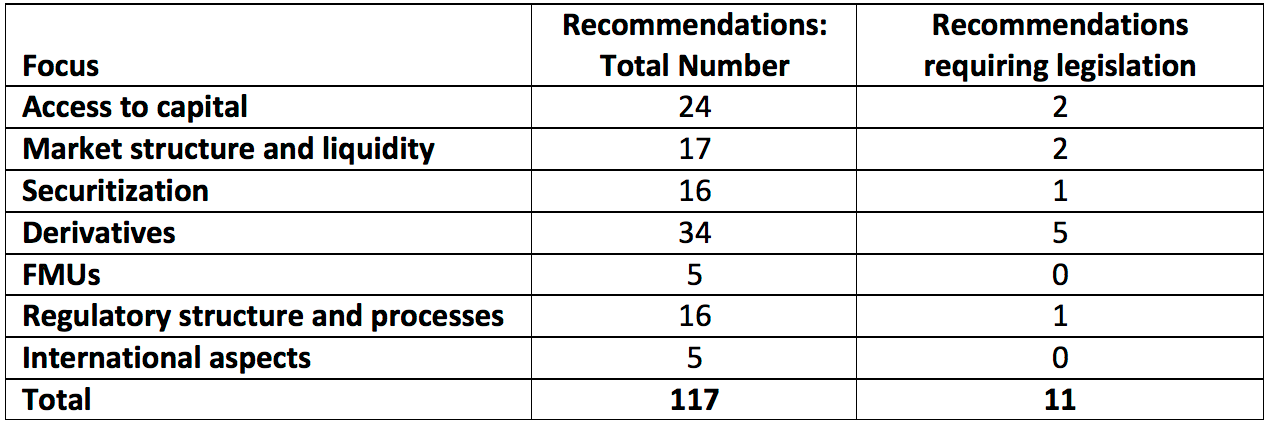
Note: The totals treat bulleted items within a recommendation as distinct proposals. Source: Authors' calculations based on U.S. Treasury, A Financial System That Creates Economic Opportunities: Capital Markets, October 2017, Appendix B.
Our overall reaction is that Treasury’s predispositions—which were more clearly evident in the earlier report—encourage doubts. To us, the numerous proposals look lopsided in favor of providing “regulatory relief” even where systemic concerns may persist. For example, in various instances (including securitizations, the supplementary leverage ratio, or the surcharge for global systemically important banks) Treasury judges capital requirements as effectively too high. There are few, if any, cases where Administration officials criticize capital requirements as too low. And, taking their cue from the financial industry, Treasury is quick to blame financial regulation for market liquidity concerns in securities such as corporate bonds, where the case for a post-crisis loss of liquidity itself remains questionable and a wide range of non-regulatory factors (such as the advent of alternative trading systems) influence the willingness of dealers to supply liquidity (see our earlier discussion here, as well as Adrian et al and the August 2017 SEC staff report on Access to Capital and Market Liquidity).
Despite its stated goal of promoting efficiency, the Treasury report also rationalizes what we view as the costly complexity of the U.S. capital markets regulatory framework. After explaining the jurisdictional overlap between the Securities and Exchange Commission (SEC) and the Commodity Futures Trading Commission (CFTC)—and the burdens imposed by less-than-harmonious, duplicative regulation—the report downplays the case for merging these agencies into a single capital markets regulator.
Perhaps the most constructive of the Treasury’s recommendations are those encouraging regulators to limit the threat to the financial system and to taxpayers from the possible failure of an FMU, an issue that we addressed earlier this month. Another useful element is the recognition of the need for better data (for example, with respect to the U.S. Treasury market), so that market participants and regulators alike can assess vulnerabilities. And, the report acknowledges the need for international regulatory coordination in a world of globally integrated markets.
From our perspective, a key value of the second Treasury report lies not in its recommendations but in its up-to-date portrayals of U.S. capital markets that are—to say the least—no longer the stock or bond markets that the two of us observed during much of our professional careers.
In the remainder of this post, we discuss two important equity market trends highlighted in the report: (1) the shift from public to private capital raising; and (2) the fragmentation of trading in the public market. While Treasury proposes a number of reforms in each of these areas—to increase access to the new issues market both for firms and investors, and to ensure efficiency in the secondary market—the proposals will not return us to the simpler equity world of the 1990s (let alone earlier).
Public vs. Private Equity Markets. Since peaking at over 8,000 two decades ago, the number of domestic listed U.S. firms has nearly halved to about 4,300 (see chart). This plunge is not associated with a decline in the importance of publicly traded equities: over the same interval, the ratio of equity-market capitalization to GDP actually rose from 105 percent to 147 percent.
United States: Domestic listed firms and the ratio of their market capitalization to GDP, 1975-2016

Source: World Bank Development database.
Doidge, Karolyi and Stulz document that, compared to other countries, this dramatic decline creates a “listing gap.” From 1996 to 2012, as U.S. listings were falling by 49 percent, in a sample of 13 advanced economies, listings were rising by an average of 48 percent! Similarly, during this same period, while listings per millions of persons in the United States plunged from 30 to only 13, in a sample of 71 countries, they rose on average from 23 to 31.
A related trend is the sizable decline in the number of U.S. IPOs. Based on statistics from Professor Jay Ritter (see here), IPOs also peaked in 1996 at 677, before plunging to 74 in 2016 (see chart). The percentage decline was even larger among technology firms—from 274 to 20—while the percentage declines of IPOs backed by venture capital firms and by corporate buyouts were somewhat smaller. Adjusted for the 130-percent rise of nominal GDP over the past 20 years, the absolute proceeds from these offerings also declined.
United States: IPOs (by number and type) and aggregate proceeds (billions of U.S. dollars), 1980-2016
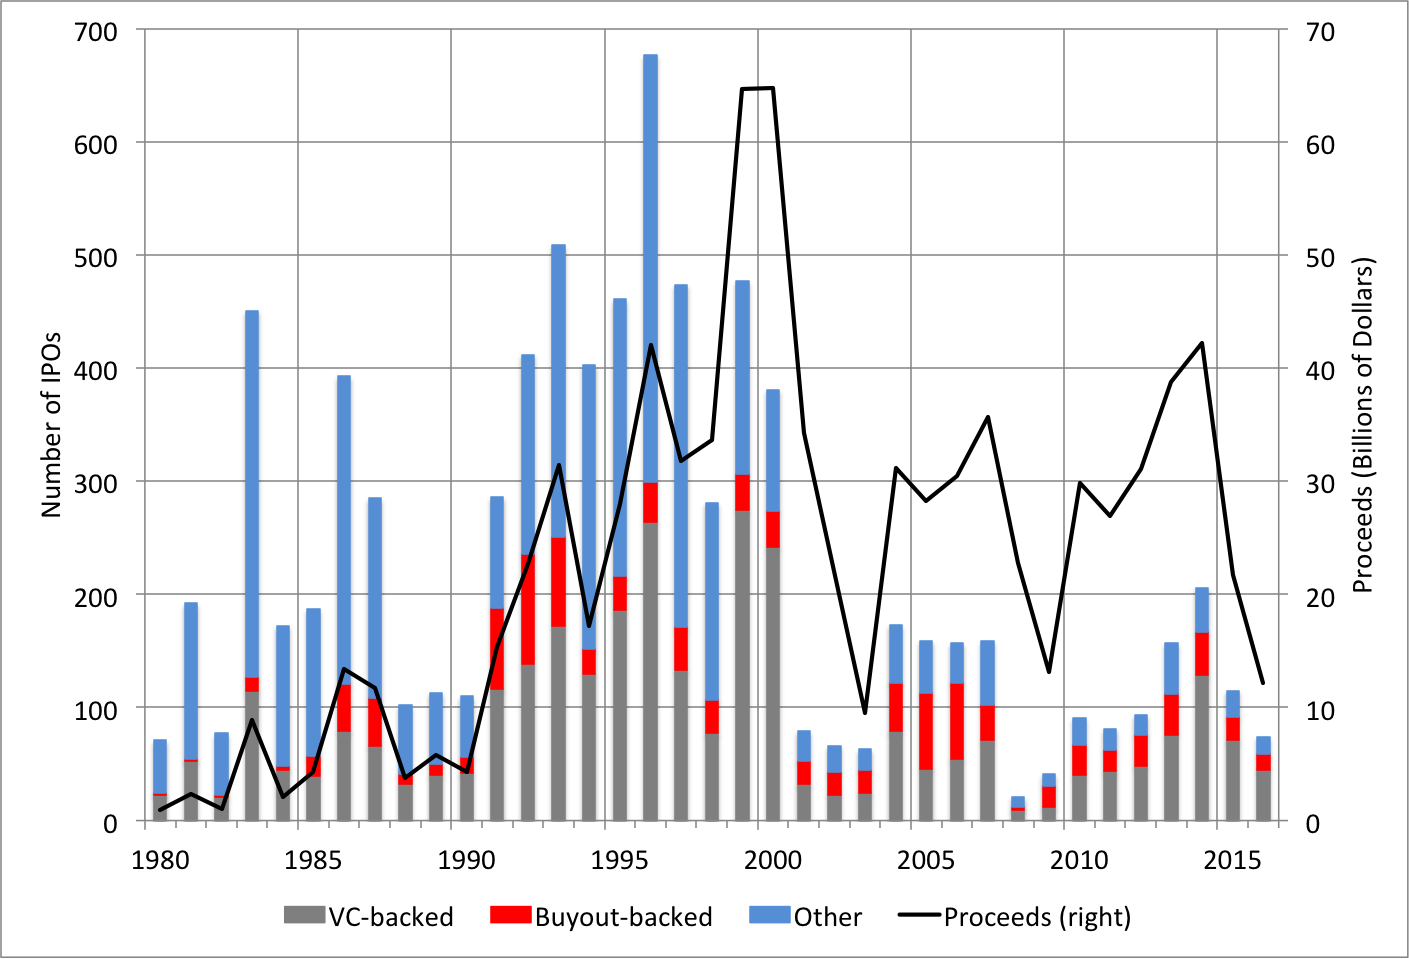
Source: Professor Jay R. Ritter IPO Data website.
As the number of publicly traded firms has shrunk, private markets for capital have flourished. Since 2009, funds raised in the private market (that is, “exempt” from SEC registration requirements) for debt and equity have exceeded funds raised in the public (registered) markets by more than 20 percent (SEC report, page 36). Given that only a small fraction of one percent of an estimated 28.8 million U.S. firms are exchange-listed (SEC report, page 37), a vibrant private market plays a critical role in supporting economic activity.
With regard to IPOs, the Treasury report highlights comments from “stakeholders” attributing the decline of public markets to “the cumulative impact of new regulations and legal developments affecting public companies since the Sarbanes-Oxley Act” of 2002. The list of factors cited include compliance costs, disclosure requirements, shareholder litigation risk, limited research coverage for smaller companies, and the role of proxy advisory firms.
The report acknowledges that non-regulatory factors “may also play a role.” In our view, that understates the well-documented counter-case made in recent academic studies. For example, Gao, Ritter and Zhu (GRZ) reject the “regulatory overreach hypothesis”―which seems to characterize the Treasury’s assessment― in favor of an economies of scope view: Small firms are “worth more as part of a larger organization.” GRZ highlight several patterns consistent with this view, including a persistent decline of small-firm profitability, an increase in the profitability of being involved in a merger or acquisition, and a decrease in the probability of a venture-capital backed firm exiting through a public IPO. The authors conclude that the decline in the number of listed firms is about big versus small, not public versus private, companies.
Doidge, Karolyi and Stulz argue that the listing gap requires a U.S.-centric explanation. In theory, that might include U.S.-specific regulatory developments. However, Doidge et al point out that half of the gap surfaced before the enactment of Sarbanes-Oxley. They also note that delisting, which accounts for nearly half of the listing gap, arises primarily as a result of takeovers by other listed companies, or “for cause” (say, if market capitalization falls too low), and not because of voluntary delisting.
All of this leads us to conclude that the firm-size threshold at which the benefits to public listing exceed the costs has risen. A key contributing factor is that small firms’ funding alternatives to IPOs have expanded, reducing the net benefit of going public. The Boston Consulting Group, for example, recently celebrated the “golden age in private equity,” noting that, since the beginning of the century, private-equity (PE) firms’ assets under management have risen by a factor of more than four, from $0.6 trillion in 2000 to $2.5 trillion today. Over the same period, the number of PE firms nearly tripled to about 4,700, while employment in the top 5 PE firms’ portfolio of companies reached nearly one million.
Of course, we welcome Treasury’s efforts to promote access to capital for new firms, which historically have accounted for more than all the net job creation in the U.S. economy. Nevertheless, in light of these trends in both public and private markets for capital, we share GRZ’s expectation that “regulatory changes aimed at increasing the number of IPOs are likely to have minor effects.”
If, alternatively, Treasury’s goal is to allow retail investors to gain access to the private investment opportunities associated with owning an interest in younger and smaller companies, there is no need to wait for an increase in IPOs. Nor do we need to ease conditions for accrediting investors to join PE pools, as Treasury proposes. Other investment vehicles—like closed-end mutual funds that operate as (or perhaps in coordination with) private equity or venture capital firms, investing portfolios of private shares in start-ups—could provide both access and diversification, while managing the inherent illiquidity of the assets. Perhaps widening public awareness of the “PE golden age” will increase demand for (and supply of) such instruments.
Secondary market trading. According to the Treasury report, a combination of technological and regulatory changes have led to a fragmentation of U.S. equity market trading across at least 52 (!) electronic platforms: 12 national securities exchanges and 40 less-regulated alternative trading systems (ATS) operated by dealers (who also operate internal trading systems). At the beginning of the 21st century, most trading of listed stocks occurred on the NYSE and NASDAQ. But since 2000, the share of activity on these two exchanges has plunged (see Treasury report Figures 3 and 4, page 53). More broadly, trading on all 12 exchanges is now less than two thirds of the total (see chart).
Equities market trading shares by venue (exchanges are shown in various shades of blue)

Note: Dark pools are venues allowing for anonymous trading, including selected ATS. Other includes internal dealer systems. Source: Reproduction of Treasury report Figure 5 (attributed to Rosenblatt Securities, July 2017)
The Treasury report notes several related, important trends:
- Automated trading: Algorithms using market price and order data now drive trading across exchanges and ATS platforms. With transaction speed measured in millionths of a second (microseconds), market participants pay to place their own servers in close physical proximity to those of the exchange. The goal of this “colocation” is to reduce data latency (since the pace of transmission is limited by the speed of light), gaining a microsecond or two advantage over other high-frequency traders (HFT).
- Demutualization and competition: Having evolved from member-owned nonprofits, today’s for-profit entities operate multiple exchanges across borders. Venues compete to attract orders in various ways, including paying for order flow, offering a dizzying array of new order types, or allowing trade concealment from exchanges (dark pools).
- Liquidity: Trading costs have fallen markedly, but trading size has, too. Block trades (those containing at least 10,000 shares) accounted for half of NYSE volume in the 1990s. Today, that number is 8 percent (see here). The Treasury report notes that liquidity for small-firm shares is lower than that for large-cap shares—worrying that illiquidity impedes IPOs. However, Angel, Harris and Spatt document that the liquidity of small-firm shares has risen notably from a decade ago.
Despite the extraordinary speed of transactions, and the broad reduction in trading costs, the increase in market fragmentation and complexity has several unappealing characteristics. First, investors can no longer be confident that their orders will be executed at the best possible price across all the trading venues—some of which are effectively hidden from the “national market.” Put differently, the National Best Bid and Offer (NBBO) price—which the SEC (through Reg NMS) obliges dealers to meet when executing customer trades—doesn’t cover the whole array of available bids and offers. Second, according to the Treasury report, these execution obligations prompt broker-dealers to purchase costly data feeds even from small exchanges where few transactions occur—encouraging the inefficient proliferation of platforms. Third, in the absence of brakes on execution speed, not only will the HFT arms race continue, but asset managers will have an increasing incentive to conceal transactions—to ensure that the benefits of any portfolio adjustments are not siphoned off by HFT algorithms that trade a nanosecond faster.
In concluding the section on equity market structure and liquidity, the Treasury report makes 11 recommendations, all directed at the SEC. These include: encouraging greater liquidity for the shares of small firms; ensuring that dealers guard clients’ interest when accepting compensation from trading platforms for routing orders; increasing competition in the provision of market-sensitive data; limiting platform proliferation and order-type complexity; and, enhancing alternative trading system disclosure. Unfortunately, none of the proposals seems likely to have much impact on the market fragmentation that the report highlights. Nor is it likely that further improvement in secondary market liquidity for small stocks would (in line with a key objective of the report) significantly boost IPOs.
More broadly, there is no reason to think that we are heading back to the simpler equity market that prevailed as recently as 20 years ago. That’s not so bad: the U.S. equity market (especially including both its public and private components) is easily the world’s largest and most liquid. And we probably couldn’t return to a simple framework without severely diminishing the efficiency of the market we now have. While regulators need to remain vigilant about promoting efficiency, fairness and safety, they also should be humble about their ability to guide structural change without unintended and possibly harmful consequences.