
The Price is Not Right: Measuring Inflation in a Pandemic
[W]hen you can measure what you are speaking about, and express it in numbers, you know something about it; but when you cannot measure it … your knowledge is of a meager and unsatisfactory kind.” Lord Kelvin, Popular Lectures, Vol. I, p. 73.
Are prices really plummeting? If you watch the official government gauge of prices in the economy, you would think so. Between March and April, the Consumer Price Index (CPI) dropped by 0.8 percent―that’s a decline of 9.1 percent at an annual rate! Even if we exclude food and energy, prices still fell at half that rate. And, both price measures already had begun to fall the previous month. Is this the new trend? Are we in the midst of a deflation? The short answer is no.
The pandemic is an enormous shock to both supply and demand (see our earlier post). The productive capacity of the economy is lower both now (with the lockdown) and in the medium term (with the need to make economic activity biologically safer). Similarly, demand is lower both temporarily while people stay at home and in the longer term as the propensity to save rises to enable people to pay off elevated debts and build precautionary buffers. Determining which of these shifts prevails is essential for policymakers. If the demand contraction dominates, then trend inflation will fall and policymakers will need to implement further expansionary policies. Conversely, if trend inflation rises (implying that the supply constraints prevail), then policymakers will eventually need to introduce restraint.
We have a myriad of inflation measures, each with their own advantages and disadvantages. When prices, consumption and production evolve gradually, the various metrics give roughly the same signal. But in recent months, with as much as one-quarter of the economy temporarily shut down and a large fraction of the population spending virtually all of their time at home, the differences have grown, adding to the challenge of filtering the trend inflation signal from the very noisy monthly price data.
In this post, we discuss the difficulties of measuring inflation during a pandemic—when demand and supply both shift dramatically. Our conclusion is that some indices provide better high-frequency signals of the trend. Unsurprisingly, headline measures of inflation are especially poor. Yet, traditional measures of “core inflation” that exclude food and energy may be equally bad. Instead, we suggest focusing on the “trimmed mean,” a statistical construct that disregards all goods and services whose prices change by the largest amounts (either up or down). In recent months, the trimmed mean CPI shows suggest that inflation has edged lower, but remains between 1½ and 2 percent per year.
As we note in our primer, price measurement is key to evaluating how the economy is doing. We use price data to figure out what fraction of a change in nominal income represents real growth and how much is just inflation. For an inflation-targeting central bank, price indexes guide policy and are essential for public accountability. To be credible, that number must have a foundation in established scientific methods (see the opening quote from Lord Kelvin). The properties of the index―how well it reflects the quantity we are ideally trying to measure―affects both how the policy target is set and how the authorities achieve their goal.
The two most prominent economy-wide price measures in the United States are the consumer price index (CPI) computed by the Bureau of Labor Statistics (BLS) and the personal consumption expenditures (PCE) price index published by the Bureau of Economic Analysis (BEA). The CPI answers the following question: “How much more would it cost today to purchase the same basket of goods and services that was bought at some fixed date in the past?” Doing this requires two pieces of information: the price of each item in every month and the fraction of expenditure the average household spends on it. The aggregate price index is then the sum of the prices multiplied by the expenditure shares (the weights).
The PCE price index differs from the CPI in both scope and in the method for computing the weights. While the CPI focuses on out-of-pocket expenditure, the PCE price index includes expenditures individuals do not pay for directly (including most of health care). As for the weights, those in the CPI only change every two years, while those for the PCE price index adjust every period using a method called “chain-weighting.” (For a detailed comparison of the CPI and the PCE price index, see here and here). There also is a chained CPI measure that adjusts the weights with each period, but it receives far less attention.
Even in normal times, our price indexes are far from perfect. Changes in relative prices alter consumption patterns that fixed-weight measures do not capture. And, quality improvements can be associated with price increases that are misinterpreted as inflation. When new goods first appear, it is a challenge to include them. And, it is important to reflect the migration of sales from small retailers to larger discount stores and online sellers. Reflecting these well-known difficulties, our measures of inflation have displayed an upward bias for decades. The current estimate is that annual CPI inflation is about 0.85 percent points too high, while inflation measured by the PCE price index is roughly 0.5 percentage points too high (see here).
The pandemic dwarfs these conventional problems. It both renders some prices unavailable and triggers large, rapid changes in consumption patterns. We discuss each of these in turn.
Starting with prices, with establishments closed and items out of stock, many prices are simply missing. In a normal month, BLS on-site surveys account for two-thirds of the prices included in the CPI. However, the BLS currently is not visiting commercial outlets in person to collect these data. As a result, in computing the April 2020 CPI, one-third of prices were missing—more than twice the usual proportion.
Second, the changes in expenditure patterns are extremely large. One high-frequency source reports sharp declines to mid-April 2020 for apparel, autos, fine dining and travel (see here). Meanwhile, groceries, food delivery, office supplies and liquor store sales are all up.
Against this background, the standard methods for addressing missing prices and changing expenditure patterns make current price readings much less informative than usual. For missing prices, the procedure is to use the known price from the previous period, effectively assuming that it is unchanged. As for expenditure shares, in between the biennial comprehensive revision, the CPI weights are largely unchanged.
Diewert and Fox highlight the problems with these procedures amid the COVID-19 epidemic. Rather than reflecting a firm-level reporting delay or oversight, the lockdown means that a number of goods and services are simply unavailable. They argue that the theoretically correct response is to replace missing prices by reservation prices. The reservation price is the lowest price that drives demand down to zero. Since demand generally falls as prices rise, we can imagine raising the price until demand has disappeared completely―that is the reservation price. As a result, reservation prices will be higher than the prices in the previous period. So, assuming that missing prices are unchanged means that reported inflation is too low. And, from a welfare perspective, by underestimating inflation, we are overestimating consumption.
From a theoretical perspective, the use of reservation prices makes sense. From a policy perspective, however, rather than helping to reveal the trend of inflation, it adds short-run volatility. In cases where demand has not shifted, the before- and after-lockdown prices will tend to be similar, but using the reservation price temporarily will introduce an increase followed by an equal-sized decline. Analogous to seasonal factors like a snowstorm, a holiday or a vacation, it seems more reasonable to look past these disturbances. We will return to this in a moment.
In addition to missing prices, the pandemic is altering consumption patterns. Most of us will visit dentists when they reopen. However, spending on travel, live concerts, sports events and eating in restaurants could remain depressed for some time.
One solution is to adjust the expenditure weights more frequently. This is what the BEA’s PCE price index and the BLS’s chained CPI strive to do. Roughly speaking, these indexes use the average of the previous and current period’s expenditure shares to weight prices. In practice, however, it takes a few months to collect the required expenditure shares, reducing the timeliness of the information. In the future, the use of high-frequency electronic payments information could solve this problem, creating a nearly continuous expenditure survey―something that Diewert and Fox suggest.
But chain-weighting also has the potential to generate volatility. To see why, consider the simple case where consumer expenditure plunges to zero during the lockdown, but returns to its original level following the reopening. Like the use of reservation prices to replace missing prices, this creates short-run changes in the index (in the opposite direction).
From the perspective of a policymaker interested in monitoring the trend of inflation over the medium term, the goal is to filter out the high-frequency noise regardless of the source. The traditional method of removing food and energy works so long as these two sectors are the leading sources of volatility; something that is surely not the case right now.
The trimmed mean is a simple alternative measure of trend inflation. Instead of arbitrarily ignoring food and energy, it excludes all items with large price changes (up or down). Put differently, the trimmed mean tracks the low-frequency movements in headline inflation. There is a trimmed mean for both the CPI and PCE price indexes (see here and here).
Since the CPI release appears several weeks before the one for the PCE price index, to understand the latest developments, we focus on that. The following chart shows the 6-month change in three measures of CPI inflation. As we expect, the headline measure (the solid black line) shows by far the most volatility. The traditional core (the dashed blue line) is much smoother, but falls markedly in recent months. While the trimmed mean (the red line) often tracks the CPI excluding food and energy, it has been much more stable in recent months.
Consumer price inflation (Six-month percent change at an annual rate), 2000-April 2020
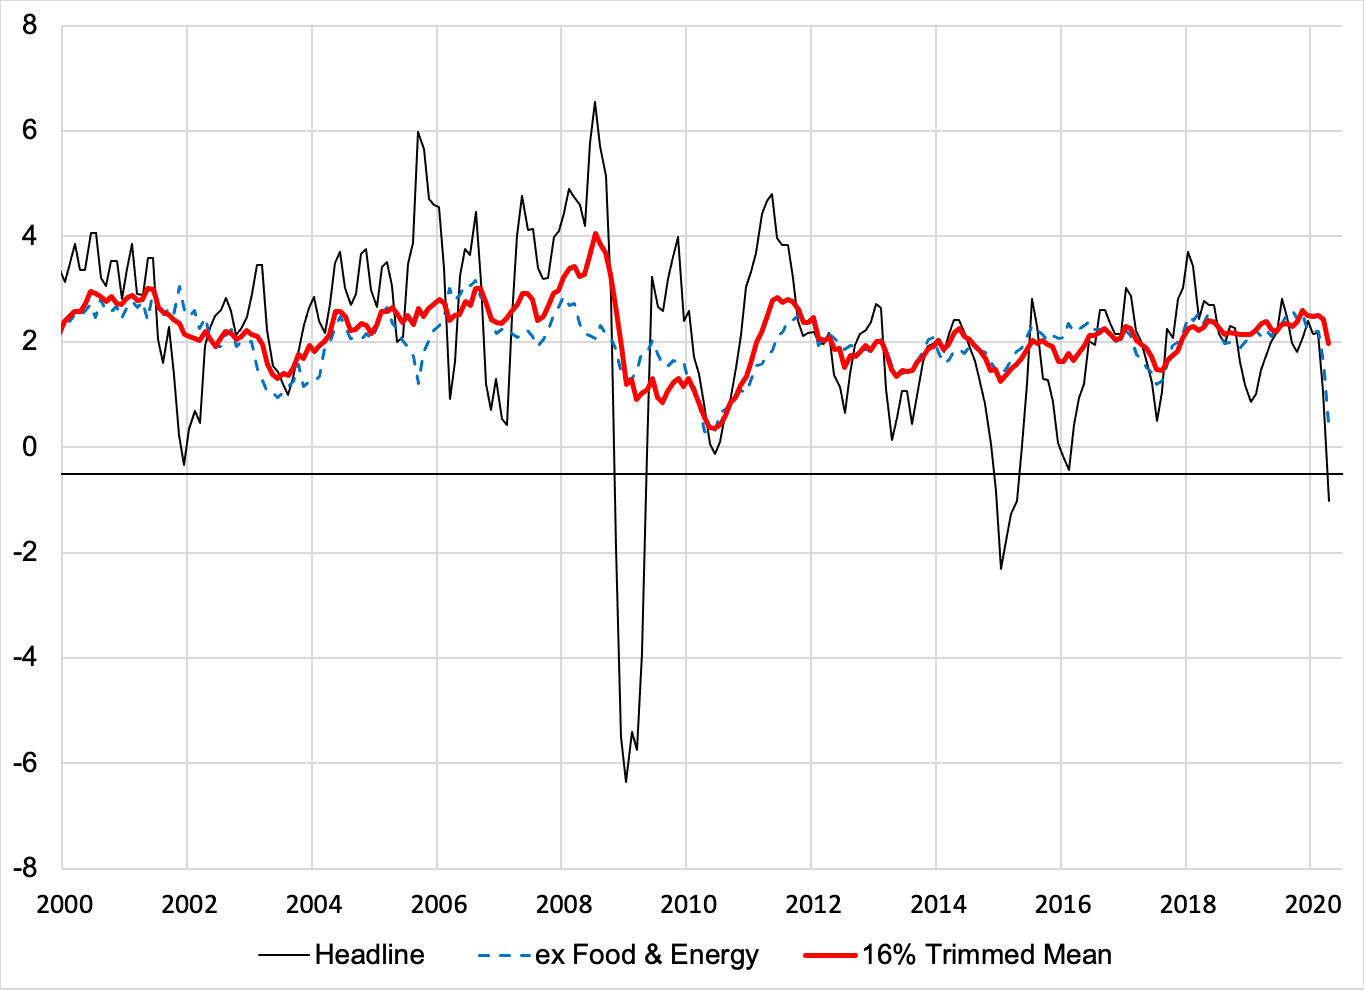
Source: FRED, Federal Reserve Bank of Cleveland, and authors’ calculations.
How should we interpret the recent readings? First, the plunge of energy prices accounts for the gap between the headline and the ex-food and energy measure. However, while declines in the prices for apparel and travel services drove the latter measure down, the trimmed mean excludes all these outliers.
There is a simple way of illustrating the benefits of the trimmed mean as a trend indicator in the immediate setting. Recall that the April 2020 headline CPI dropped at a 9.1 percent annual rate from March. Using the component data, suppose that we assign a zero weight to the categories where expenditure shares likely collapsed: food away from home, transportation services, apparel, and energy commodities. The resulting inflation estimate is +1.6 percent at an annual rate―a level very close to the trimmed mean over the past six months (the last point in the red line in the chart).
In closing, while recent inflation readings suggest that prices are falling rapidly, a closer look suggests that the changes are modest. Based on the limited information available, we believe that trend inflation is currently between 1½ and 2 percent. Of course, we will learn considerably more coming months. The reopening could lead to price reversals, while the chained-price measures will incorporate far more complete information about the rapid changes in expenditure shares.
As this happens, we will focus especially on the trimmed-mean PCE price index. It has time-varying weights that track changes in expenditure patterns, while filtering out the largest transitory price movements. Over the next few months, this will give us—and Fed policymakers—a far more useful indication of the inflation trend for guiding the central bank’s policy setting.