
Making the Treasury Market Resilient
“[A]ny significant disruption in the Treasury market would likely impact financial stability.”
Treasury Market Practices Group, “White Paper on Clear and Settlement in the Secondary Market for U.S. Treasury Securities,” July 11, 2019.
“Having pushed for the move to greater central clearing, global authorities have a responsibility to ensure that CCPs do not themselves become a point of failure for the system.” Then-FRB Governor Jerome H. Powell, Speech at the FRB Chicago Symposium on Central Clearing, June 23, 2017.
Ensuring financial stability requires both resilient institutions and resilient markets.
Everyone pays the price when banks and the like collapse. That is why regulators around the world have strengthened capital and liquidity requirements for the largest financial intermediaries since financial crisis of 2007-09.
Making financial markets resilient is equally important. Repeated and sustained bouts of illiquidity and dysfunctionality in a key market can threaten the well-being of even the healthiest institutions.
In a global financial system that runs on dollars—where the U.S. dollar is the key reserve currency and a substantial fraction of intermediation is denominated in dollars—the most important financial market is the one for U.S. Treasury securities. Treasuries are the safest and most liquid instruments in the dollar world:
The Treasury market is the most active fixed-income market, exhibiting the highest trading volume and the smallest bid-ask spreads.
Treasuries represent the highest quality collateral for attracting dollar liabilities.
Treasuries account for the largest component of foreign exchange reserves, with foreign official institutions holding about 20 percent of the $20.6 trillion in the hands of the public.
Treasuries serve as the benchmark for measuring both credit and liquidity risk.
Yet, despite its importance and general reliability, the Treasury market occasionally suffers from serious disruptions. Most of these instances are temporary. For example, the extraordinary volatility on October 15, 2014 (see the 2015 Joint Staff Report) lasted less than 15 minutes. However, the severe and longer-lasting disruptions in the Treasury market during the first half of March 2020 became an important motivation for the Federal Reserve’s unprecedented anti-COVID policy actions beginning that month (see here, here and here).
Given its systemic importance, the Fed has clear justification for acting to ensure the smooth functioning of the Treasury market. It is difficult to imagine markets for risky and less liquid assets operating smoothly if the Treasury market is in disrepair. Furthermore, as it was in World War II, indirectly supporting the financing of the federal government is a critical function of the Federal Reserve during the current battle against COVID.
This is not the first time that the Fed has had to rescue the Treasury market. There were previous instances in 1939, 1958 and 1970 (see Garbade and Keane). But, as important as it surely is, if Treasury market participants expect that the Fed will supply emergency liquidity whenever things go haywire, the result would be a weaker financial system. To limit such moral hazard, the key is to make the Treasury market more resilient. (Naturally, the same considerations apply to other critical markets—such as those for repurchase agreements and securities lending, both of which we discussed in the past.)
In the remainder of this post, we describe the COVID-induced troubles in the Treasury market and highlight Duffie’s compelling proposal to consider requiring central clearing of U.S. Treasuries. We endorse Duffie’s call to study such a mandate, and view this is as an important element of a broader effort to modernize and reinforce the financial infrastructure.
COVID Triggers Liquidity Demand. In the run-up to the COVID crisis, investors followed a familiar pattern: anticipating a recession, they fled to safety. At the start of 2020, the 10-year Treasury yield stood at 1.88%. On March 9, it hit a record low of 0.54%─a drop of 130 basis points. Then, the market turned. Over the next nine days, massive sales by foreign officials needing dollars to on-lend to banks and by leveraged speculators seeking to close out loss-making relative value trades in Treasurys and Treasury futures drove rates back up (see, for example, the BIS Annual Economic Report 2020, page 44, and Barth and Kahn). This scramble for liquidity boosted the 10-year yield to 1.18% by March 18. To put this into perspective, someone investing in a $100 face value 10-year Treasury bond (coupon rate of 1.88%) in January would have seen the value of their investment first rise from $100.00 to $113.03, before plunging back in the space of nine March days to $106.58.
The problems on March 9 stemmed from the inability of Treasury market makers to satisfy very large demands to sell without precipitating large price changes that had little to do with economic fundamentals. One way to measure this loss of liquidity is to track the emergence of a yield spread between the closest “off-the-run” and the “on-the-run” most recently issued 10-year Treasury bond (OTR). Since both are backed by the full faith and credit of the U.S. federal government, and because the difference in tenor is only a few months, they are nearly identical in terms of maturity and default risk. Consequently, this yield spread is a proxy for liquidity conditions. (As Adrian, Fleming and Vogt discuss, the OTR spread widened sharply both in the crisis of 2007-09 and around the 1998 near-failure of LTCM.)
The following chart shows the sudden emergence of the OTR spread during the second week of March, just as investors sought to sell their bonds and expectations were rising of increased Treasury issuance. The red bars depict the gap in basis points between the yields on the 10-year bonds issued in November 2019 and on those issued in February 2020. Having jumped on March 9, the spread remains notably positive until the Fed begins its massive purchase programs, adding more than $1.1 trillion to its holdings between March 11 and April 8. Looking at the black line in the chart, we see the Fed’s rate of acquisition peaked at a phenomenal $362 billion in the week ended April 1. Indeed, the Fed absorbed so many Treasurys in mid-March that by March 26 the OTR spread turned perversely negative.
Off- vs. On-the-run 10-year Yield Spread (daily, basis points) and the Change in Fed Holdings of Treasuries (weekly, billions of dollars), February 12, 2020 to April 30, 2020
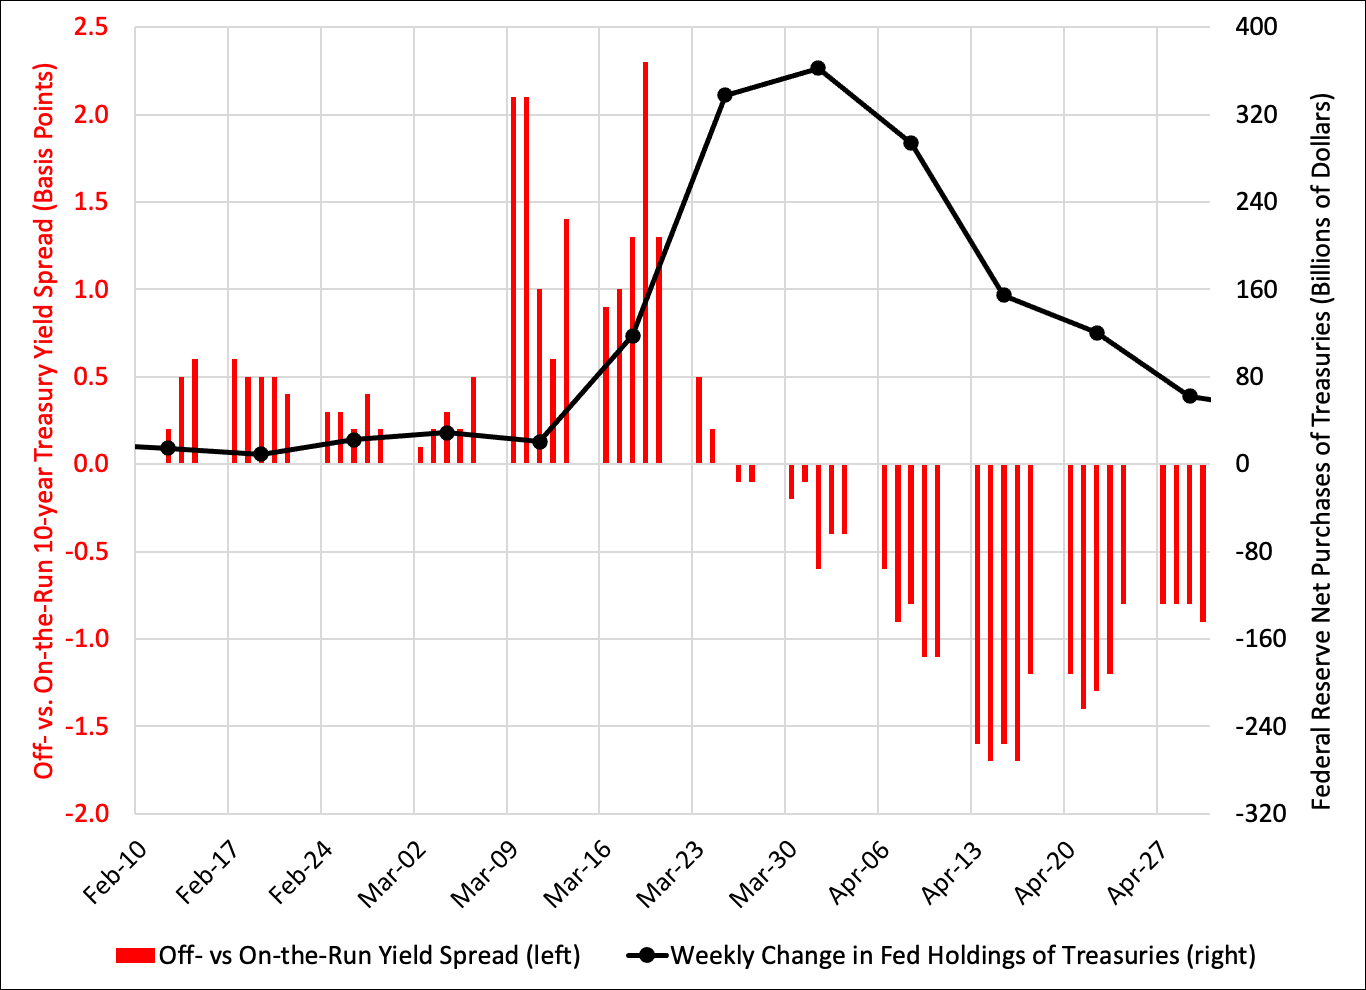
Source: BIS Annual Report 2020 Graph II.A for the OTR yield spread and FRED for the Fed’s Treasury holdings.
Additional evidence confirms the presence of considerable strains in the Treasury market during this period. For example, the Treasury’s Office of Financial Research notes surging Treasury yield volatility (which peaked on March 19 about 10% higher than the 2007-09 financial crisis peak). And, data from the Federal Reserve Bank of New York shows that trading of Treasuries on the part of primary dealers was the highest on record, peaking at a weekly volume in excess of $1 trillion at the beginning of March.
Coincidentally, in the first week of March, the Financial Industry Regulatory Authority (FINRA) began publishing comprehensive Treasury transaction volume data (from its TRACE system) that includes trades by the automatic trading systems (ATS) widely used by firms active in the Treasury market. While the period of data availability is brief, the chart below shows that Treasury coupon bond and note transactions reported through TRACE peaked in the first week of March at over $5 trillion, with the share of interdealer and ATS transactions accounting for nearly 60% of that total. By April, trading had declined to about $2 trillion weekly, with the interdealer share temporarily dropping below one-half.
Volume of transactions in Treasury coupon securities (trillions of dollars), Week ending March 6 to August 7

ATS automated trading systems. Note: The data do not distinguish between interdealer and ATS trading. Source: FINRA and authors’ calculations.
Some observers suggest that a combination of leverage and liquidity requirements limits the capacity of market makers to absorb large sales. That is likely one reason why the Fed moved this year to relax the supplementary leverage requirement on the largest banks by excluding holdings of Treasuries from the denominator. (By setting a minimum standard for funding assets with equity, the leverage ratio can diminish the incentive for intermediaries to hold the inventories necessary to act as Treasury market makers.)
However, regardless of regulatory requirements, if major strains occur only once or twice a decade, market makers surely view the level of inventories needed to meet such outsized liquidity demands as far too expensive to carry permanently. Beyond the cost, they also know from experience that the central bank has a powerful (perhaps irresistible) incentive to serve as the liquidity backstop when big shocks occur. Put differently, market makers are likely to view reliance on the Fed backstop as a viable strategy for managing risk when liquidity demands surge.
Furthermore, given the massive expansion of the Treasury market currently underway, we should be prepared for the possibly frequent recurrence of episodes in which the need to absorb large Treasury sales suddenly arises. The chart below shows the scale of publicly held Treasuries as a ratio to GDP starting in 1900. The July projection by the Committee for a Responsible Federal Budget (based on the CBO’s post-COVID economic forecast) surpasses the previous U.S. record (set in 1946) already next year, rising to 121% in 2030.
Treasury debt held by the public (percent of GDP), 1900-2030P

Sources: Pre-COVID projection by CBO. Post-COVID projection by Committee for a Responsible Federal Budget (partly based on interpolation by the authors).
Central clearing can lower liquidity needs. All of this leads us to conclude there is an urgent need to redesign the Treasury market’s plumbing to conserve on liquidity in the event of future shocks like the one we saw in March. This is precisely Duffie’s objective in proposing that we consider a mandate for central clearing of Treasuries.
Central clearing parties (CCPs) are the buyer to every seller and the seller to every buyer. When a CCP has a large share of the overall market, “multilateral netting” by the CCP within the settlement period (which is one day for Treasuries) can vastly reduce liquidity needs compared to a bilateral over-the-counter (OTC) settlement system. The idea is that many gross trades can be netted because they mirror each other (e.g. A sells to B; B to C; and C to A). Also known as “trade compression,” the potential for multilateral netting expands with the CCP’s share of transactions. And, by removing transactions from the system, netting effectively increases the capacity of market makers’ balance sheets. As an offset, however, a CCP requires that its clearing members (CMs) must set aside liquidity (say, in the form of margin or guarantees) to ensure the reliable operation of the CCP itself.
In 2010, the Dodd-Frank Act mandated a shift from bilateral OTC trading to central clearing for standardized derivatives. As a result, over the past year, CCPs cleared about 90% of all standard interest rate swaps (see ISDA)—a dramatic increase from the estimated 40% of all interest rate derivatives that were centrally cleared in 2009 (see FSB Figure 2). In contrast, the Treasury Market Practices Group (see Table in Section II) estimates that, as of the first half of 2017, only about one third of Treasury transactions were centrally cleared.
Duffie points out that, in addition to its negative implications for market liquidity, the lack of central clearing for Treasuries obscures market risks (such as concentrated positions, crowded trades, and inadequate margin) and increases exposure to settlement failures. Indeed, with appropriate margining, trade compression, reporting, and position liquidation procedures, CCPs also can lower counterparty risk (see Tuckman).
Costs of Central Clearing. Mandating central clearing has clear benefits, but what are the costs? The principal one is the need for solvent CMs to support the CCP in the event a CM fails. According to the Fixed Income Clearing Corporation (FICC)—which performs most of the central clearing in the Treasury market—CMs committed $91 billion in the first quarter of 2020 to cover repo and cash trading of Treasuries and Agencies in the event that the single largest CM fails (see disclosure 7.1.6 here). A more robust standard would require coverage for the simultaneous failure of two or more of the largest CMs. As we note in an earlier post, to ensure resilience and provide an incentive for prudent risk management, the CCP’s owners (who often coincide with their largest CMs) should be required to share in the costs of ensuring continuity of operations in all but the most dire circumstances.
As the opening citation from then-Governor Powell hints, the largest CCPs are far too big to fail. Not surprisingly, the Fixed Income Clearing Corporation (FICC) is one of eight U.S. firms designated under the Dodd-Frank Act as financial market utilities. That is, the FICC is certified as systemically important, allowing it to obtain collateralized emergency funding from the Fed. Importantly, the major CCPs tend to be globally interconnected because they share many large CMs, so that the stress or collapse of one CCP can easily be transmitted across borders (see our earlier post).
Conclusion. We are acutely conscious of the risks posed by large CCPs. So, we always pause before advocating the addition to or the expansion of these systemically risky behemoths. Nevertheless, in this case, we strongly endorse Duffie’s call for a cost-benefit analysis of mandating central clearing for Treasuries.
This is just one example of the necessary effort to promote the resilience of key markets in the face of rapid change. While the costs of ensuring the continuity of CCP operations are far from trivial, we suspect that the benefits of centrally clearing U.S. Treasury securities—in terms of reduced liquidity needs and of better risk management practices—will outweigh these costs. Indeed, the reduced drain on market-makers’ balance sheets should help diminish the frequency with which the Fed is compelled to rescue the Treasury market.
Authors’ note: On August 20, we updated the reference regarding previous Federal Reserve interventions in the Treasury market.