
Trend inflation: How wages and housing are sustaining momentum
“There’s good news on the month-to-month data […], but inflation remains far too high [….] We’re not near done yet.” Mary Daly, President of the Federal Reserve Bank of San Francisco, August 11, 2022.
While annual inflation may have peaked, it remains at levels we last saw in the early 1980s. Indeed, our preferred measure of the medium-term inflation trend– the six-month annualized change in the trimmed mean personal consumption expenditure price index—is up by nearly 5 percent. Fortunately, policymakers now realize the severity of the situation and are raising interest rates quickly as they work to catch up. Fed fund futures anticipate a rate of at least 3½ percent by yearend—the most rapid increase in more than 40 years. Will this be enough?
In this post, we address this question. Our conclusion is that policymakers will have to act more aggressively than financial markets anticipate if inflation is to decline to the Fed’s 2-percent target within two years. The reason is that inflation has substantial forward momentum arising from two sources. First, a tight labor market combined with elevated short-term inflation expectations appear poised to drive wage inflation higher. Second, there is the continuing impact of increases in prices of housing, both for owners and renters. So, while energy prices as well as other temporary drivers of the current high inflation are fading, and long-term inflation expectations remain reasonably contained, inflation is currently poised to remain well above 2 percent.
How did we get here? Recent increases in inflation are a result of a series of adverse supply developments combined with fiscal and monetary policy stimulus to aggregate demand. Together, these raised the trend pace of inflation by 2 percentage points, from 2 percent prior to the pandemic to 4 percent by the end of 2021 (again, using the trimmed mean PCE price index). Kalemli-Özcan and coauthors estimate that two-thirds of this increase was a result of increasing demand, with the remaining one-third coming from supply. If, during the second half of 2021, policymakers had been more focused on the importance of demand, they would surely have started to tighten policy by the fall of that year (as we and others suggested at the time).
The Russian invasion of Ukraine in late February 2022 constituted a further large adverse supply shock. In the five months to July, prices of food at home rose by 6.5 percent while energy prices jumped by 15.2 percent. Our preferred measure of trend inflation rose further, by nearly one percentage point. So, from today’s vantage point, we judge that excess demand now accounts for about one-half of the nearly three-percentage-point increase in trend inflation since early 2020.
Fortunately, as Mary Daly notes in the opening quote, some inflationary pressures are fading. The fiscal impulse of 2020-21 has become a sizable drag in 2022-23, even with the soon-to-be-signed Inflation Reduction Act. Moreover, energy prices have slipped, supply adjustments are easing bottlenecks, and the shift back to consumption of services is helping to slow goods price inflation.
Nevertheless, we still see two reasons for concern: wages and housing.
Starting with wages, the labor market remains extremely tight. As we discuss in our recent primer on the Beveridge Curve, the combination of a 3.5 percent unemployment rate and a 6.6 percent vacancy rate—nearly two openings for each person searching for a job—is unprecedented. Put slightly differently, the current unemployment rate is almost a full percentage point below the Congressional Budget Office estimate of the noncyclical rate of unemployment: this is the unemployment gap plotted as a dashed red line in the following graphs. With firms finding it so difficult to attract and retain workers, wages (measured by the FRB Atlanta wage growth tracker—the black line in the chart) are rising at an annual rate of 7.1 percent, three percentage points faster than before the pandemic. Moreover, even as output slipped this year, the extraordinary labor shortfall meant firms continued hiring, so productivity (output per hour) tumbled. As a result, unit labor costs in the second quarter of 2022 jumped by more than 9 percent from a year ago, the biggest increase since 1982.
Wage inflation and the unemployment gap, 1997-2022

Source: FRED and Federal Reserve Bank of Atlanta.
Beyond the extraordinarily tight labor market, there is a second reason to worry that wage inflation may rise further: inflation expectations. In a recent FRBSF Economic Letter, Glick, Leduc, and Pepper conclude that wages are far more sensitive to expectations of inflation one year ahead than to long-term (5-10 year ahead) inflation expectations. They find that, in addition to the unemployment gap (plotted in the previous chart) and the productivity trend, wage inflation depends in roughly equal measure on past core inflation (as measured by the CPI excluding food and energy) and on households’ one-year inflation expectations. The following chart shows these two inflation measures, with past inflation in black and expectations in red.
Consumer price inflation excluding food and energy (12-month percent change) and Household inflation expectations (one year ahead), quarterly, 1997-3Q 2022.

Using the information in these charts, combined with the estimates of Glick et al. (see Figure 3 here), we can construct a projection for wage inflation. Assuming the productivity trend going forward equals the 1.2 percent annual average for the 2010s, and noting that the unemployment gap is currently about 1 percentage point, wage growth (measured by ECI wages and salaries, the gray line in the first chart) is likely to be around 6.1 percent near term. This is roughly 3 percentage points above the pre-pandemic level that seemed consistent with the Fed’s 2-percent inflation target. Even if falling energy prices help to moderate short-term inflation expectations, as is likely, it is difficult to see why labor cost inflation will slow unless the labor market eases significantly.
Importantly, labor cost increases are a key driver of inflation’s trend. Labor compensation accounts for roughly 60 percent of per unit costs (see here). So, when wages, salaries, and benefits rise for a given level of sales, it either squeezes profits and markups, or pushes up prices. So long as demand remains strong, firms will have an incentive to continue raising prices, keeping inflation from falling.
Aside from labor costs, housing price dynamics also will impart momentum to inflation over the next year. To understand why, consider that housing is by far the largest single category of households’ outlays, accounting for about 15 percent of personal consumption expenditures. Furthermore, the housing components of the standard price indexes are computed from information about rents. National statisticians assume that homeowners rent from themselves at a price that is computed by matching housing characteristics with homes that are for in fact rented. (This is called “owner equivalent rent.”)
So much for the technicalities. Turning to the impact on inflation, when the actual sale prices of homes rise, it takes about a year and a half for these increases to show up in higher rents. Now, from the end of 2020 to mid-2022, U.S. home prices jumped by about 30 percent. Because of the lag, this surge is only now showing up in price indices.
In the following chart we show the percent change from a year ago for three indexes: the trimmed mean PCE (black), the CPI for shelter (gray) and the Case-Shiller U.S. National Home Price index (red and with a five-quarter lead). The first thing to note is that the house price index is currently rising at a rate of about 20 percent per year, outpacing the boom of the early and mid-2000s. Second, we can see that the housing price index and the CPI shelter index move together, albeit with shelter rising and falling five quarters later. Currently, shelter price gains are running at nearly a 5½ percent annual rate. Finally, overall trend inflation (measured by the trimmed mean PCE price index) moves with inflation in shelter. Compared to a year ago, it is up by about 4 percent, but as we emphasized earlier, over the past six months, it rose at an annual rate of nearly 5 percent.
Case Shiller Index, CPI Shelter, and Trimmed Mean PCE, inflation from a year ago
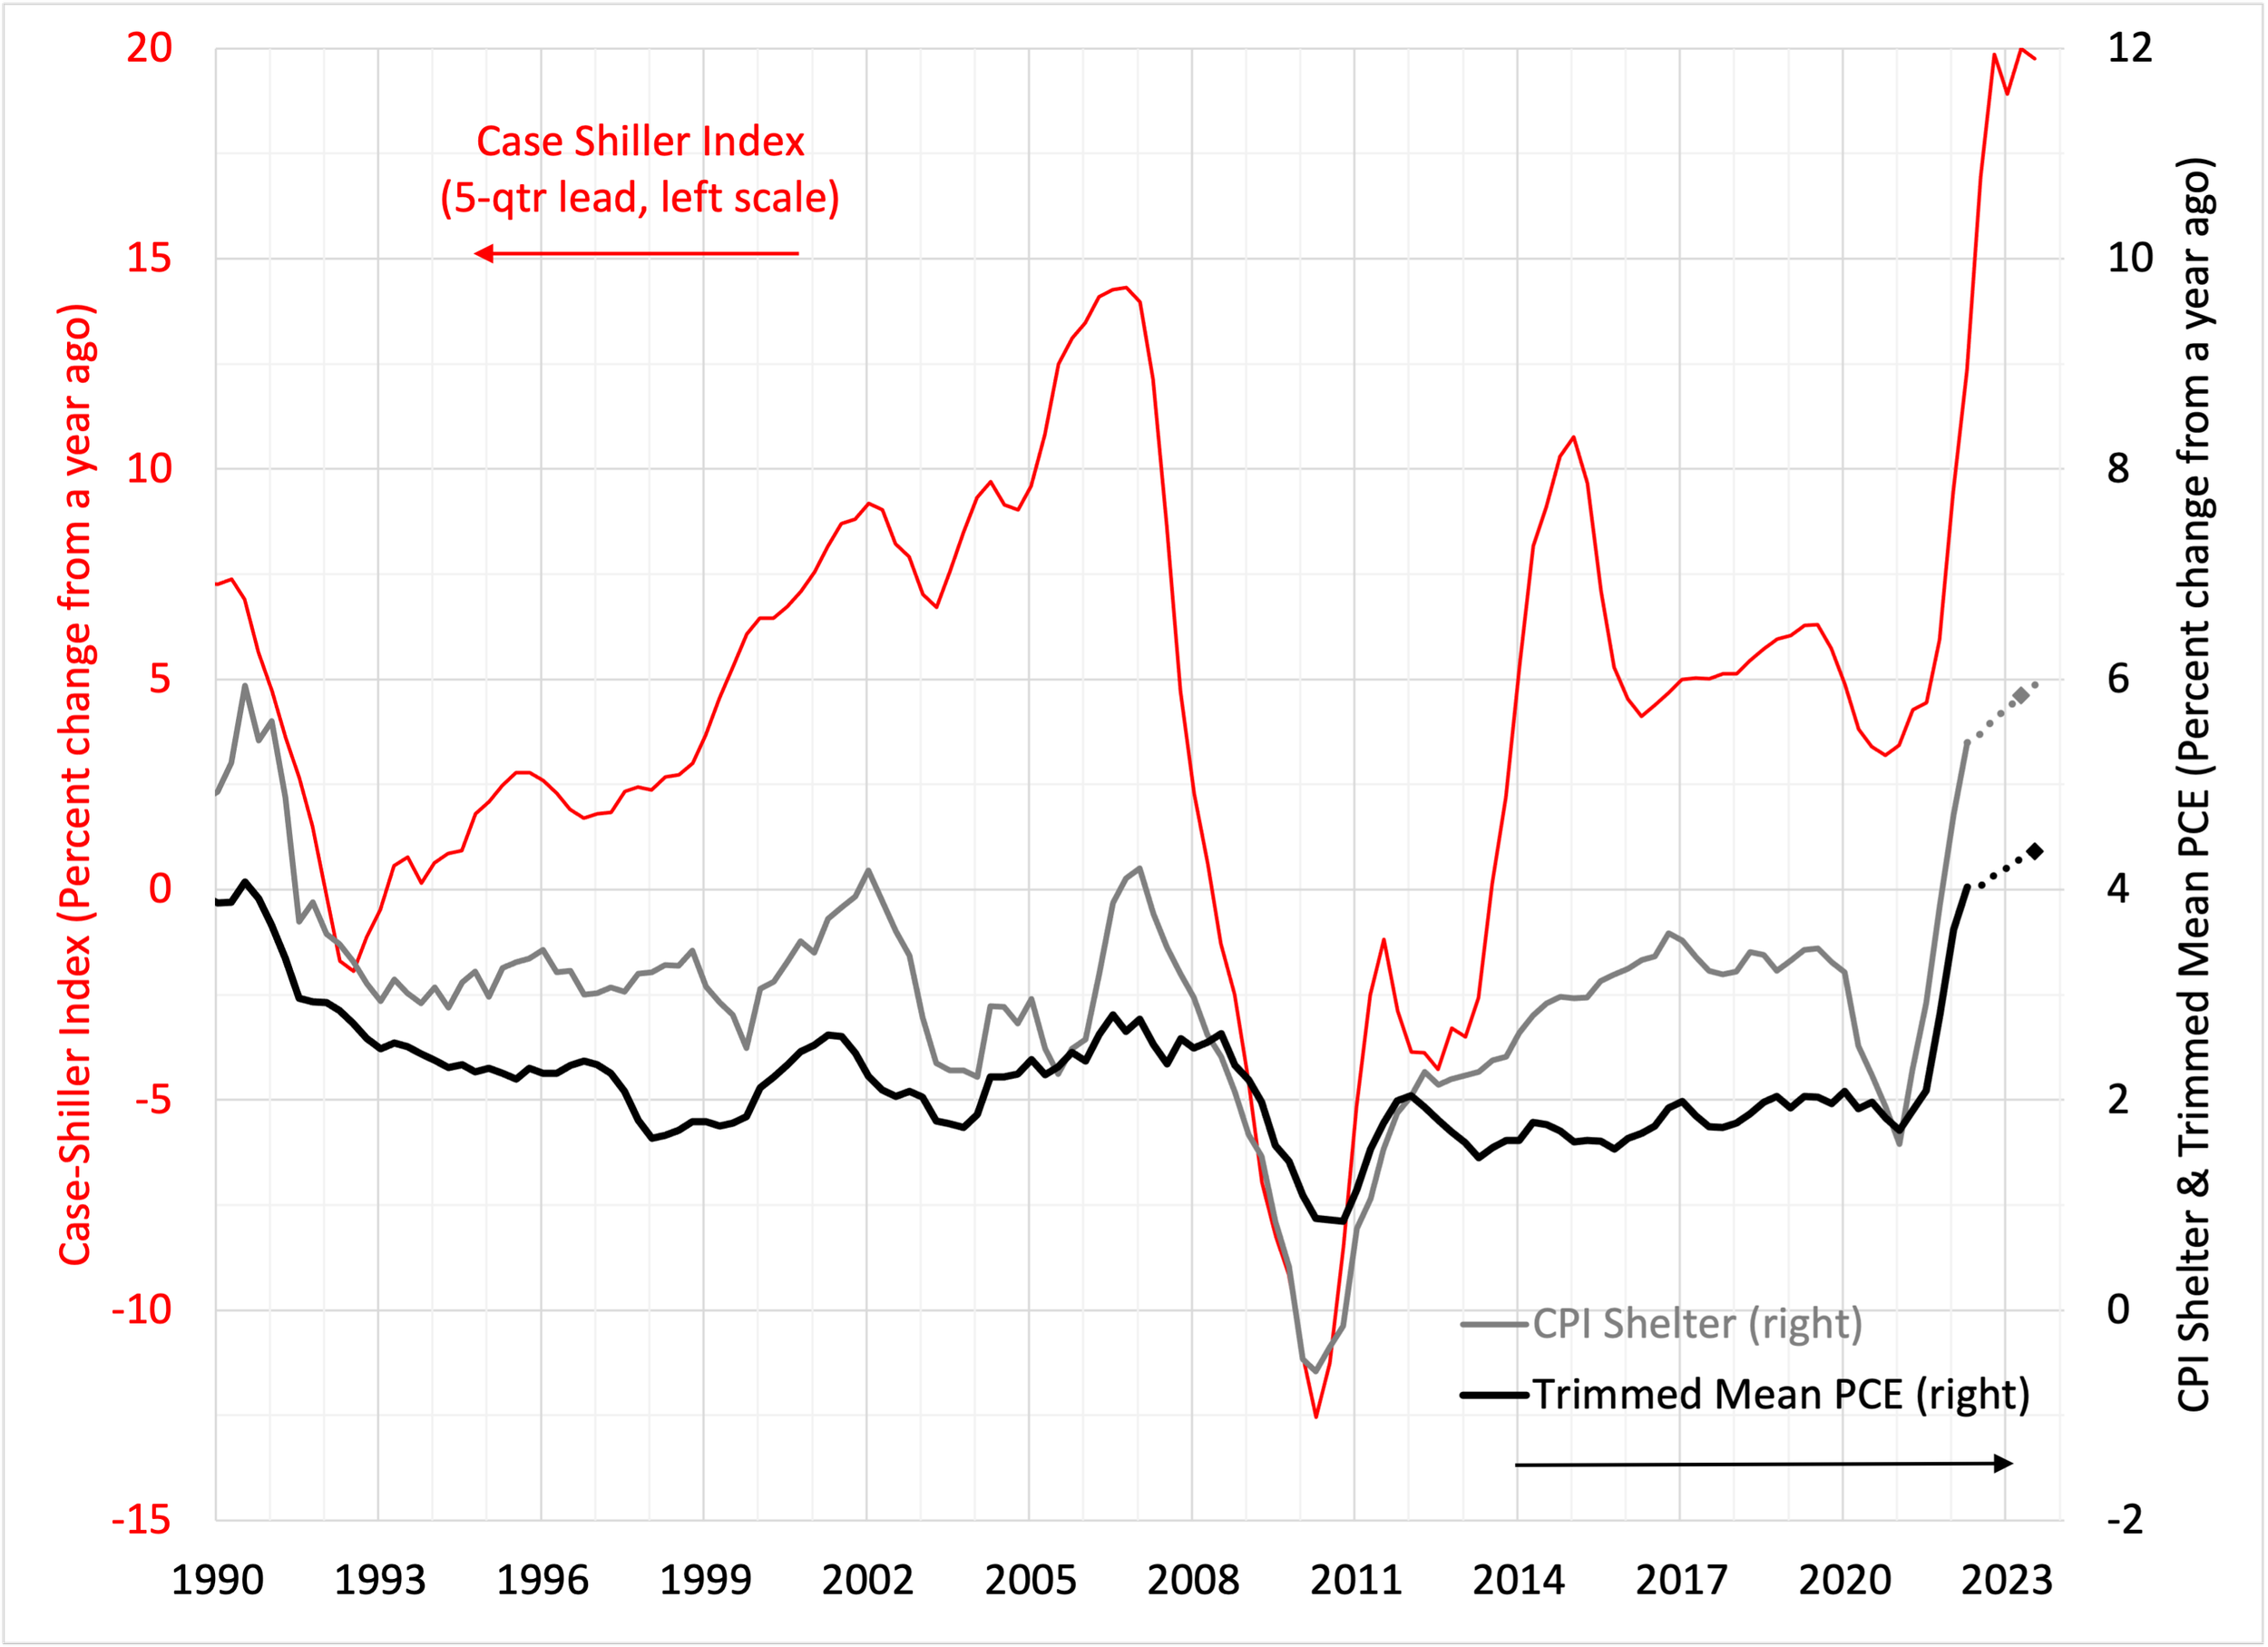
Source: FRED and authors’ calculations.
The fact that the Case Shiller home price index moves before the CPI for shelter or the trimmed mean PCE means that we can use it to generate near-term projections. These are the dashed lines to the right in the chart. The perhaps unsurprising implication is that past housing price increases are likely to push up measured trend inflation by one-half of one percentage point by mid-2023.
Our conclusion is that inflation today is more like an aircraft carrier than a sports car. It has significant momentum that is difficult to slow. The combination of a very tight labor market and elevated short-term inflation expectations are pushing up wages, driving up costs, and putting upward pressure on prices. Added to this, when home prices rise, they drive up rents several quarters later. So, while transient supply constraints are fading, prices of material inputs are slipping, and longer-term inflation expectations remain reasonably capped, the underlying trend of inflation looks poised to remain at or above 4 percent.
If we are correct, it means that bringing inflation down to the Fed’s 2 percent target will require interest rate increases beyond the 3½ percent that financial market participants anticipate. As we highlighted earlier this year, without a positive “real” interest rate—where the Fed’s policy rate target exceeds expected inflation—we doubt that trend inflation will slow significantly.
As Mary Daly said, they are “not near done yet.”