
Will Dollar Adjustment Be Smooth or Not?
“[Net] claims against residents of the United States cannot continue to increase forever in international portfolios at their recent pace. […] At some point, diversification considerations will slow and possibly limit the desire of investors to add dollar claims to their portfolios.” Allan Greenspan, then-Chair of the Federal Reserve, Remarks at the European Banking Conference, November 19, 2004.
It was only a few months ago that everyone was focusing on the U.S. economy’s exceptionally favorable fundamentals: growth was solid; driven by migration, the labor force was expanding; inflation was receding; and business formation was robust. Adding to this, U.S. capital markets were the envy of the world, as were the research centers that were advancing the technological (e.g. productivity) frontier. These elements of American exceptionalism helped push the real effective value of the dollar to a near-40-year peak in January (see chart).
U.S. Dollar Real Exchange Rate (monthly, 1981= 100), 1980-March 2025

Notes: The series shows the narrow real effective exchange rate from 1980 to 1993 and the broad effective exchange rate from 1994 to March 2025. The narrow rate is spliced to the broad rate in January 1994.
Sources: Bank for International Settlements and authors’ calculations.
How quickly things change. Chaotic policies – tariffs, overtly preferential treatment, deportations, attacks on universities, slashed research funding, and general increases in policy uncertainty – risk inhibiting growth, sparking inflation, retarding investment, and stunting technological development. Unsurprisingly, this disturbing new mix is leading many people to anticipate a decline of the dollar and to speculate about the loss of safe-haven status for U.S. Treasuries (see our recent post).
Enduring challenges for the dollar. Two factors contributing to concerns about dollar decline are not new. The first is apparent overvaluation: already in 2022, the dollar reached an unusually rich value not seen since the mid-1980s (see chart above).
The second is the heightened exposure of global investors to U.S. assets. U.S. net liabilities to foreigners – also called the net international investment position (NIIP) – are now nearly 90 percent of GDP (see chart below), while gross liabilities exceed 200 percent of GDP. As former Fed Chairman Greenspan explained more than two decades ago – when the net liability position was only about 20 percent of GDP – at some stage, concentration risk will encourage investors to diversify away from dollar assets (see the opening quote). The resulting portfolio shift likely will raise the risk premium paid by U.S. entities to issue debt or equity.
U.S. Net International Investment Position (Annual, Percent of GDP), 1976-2024
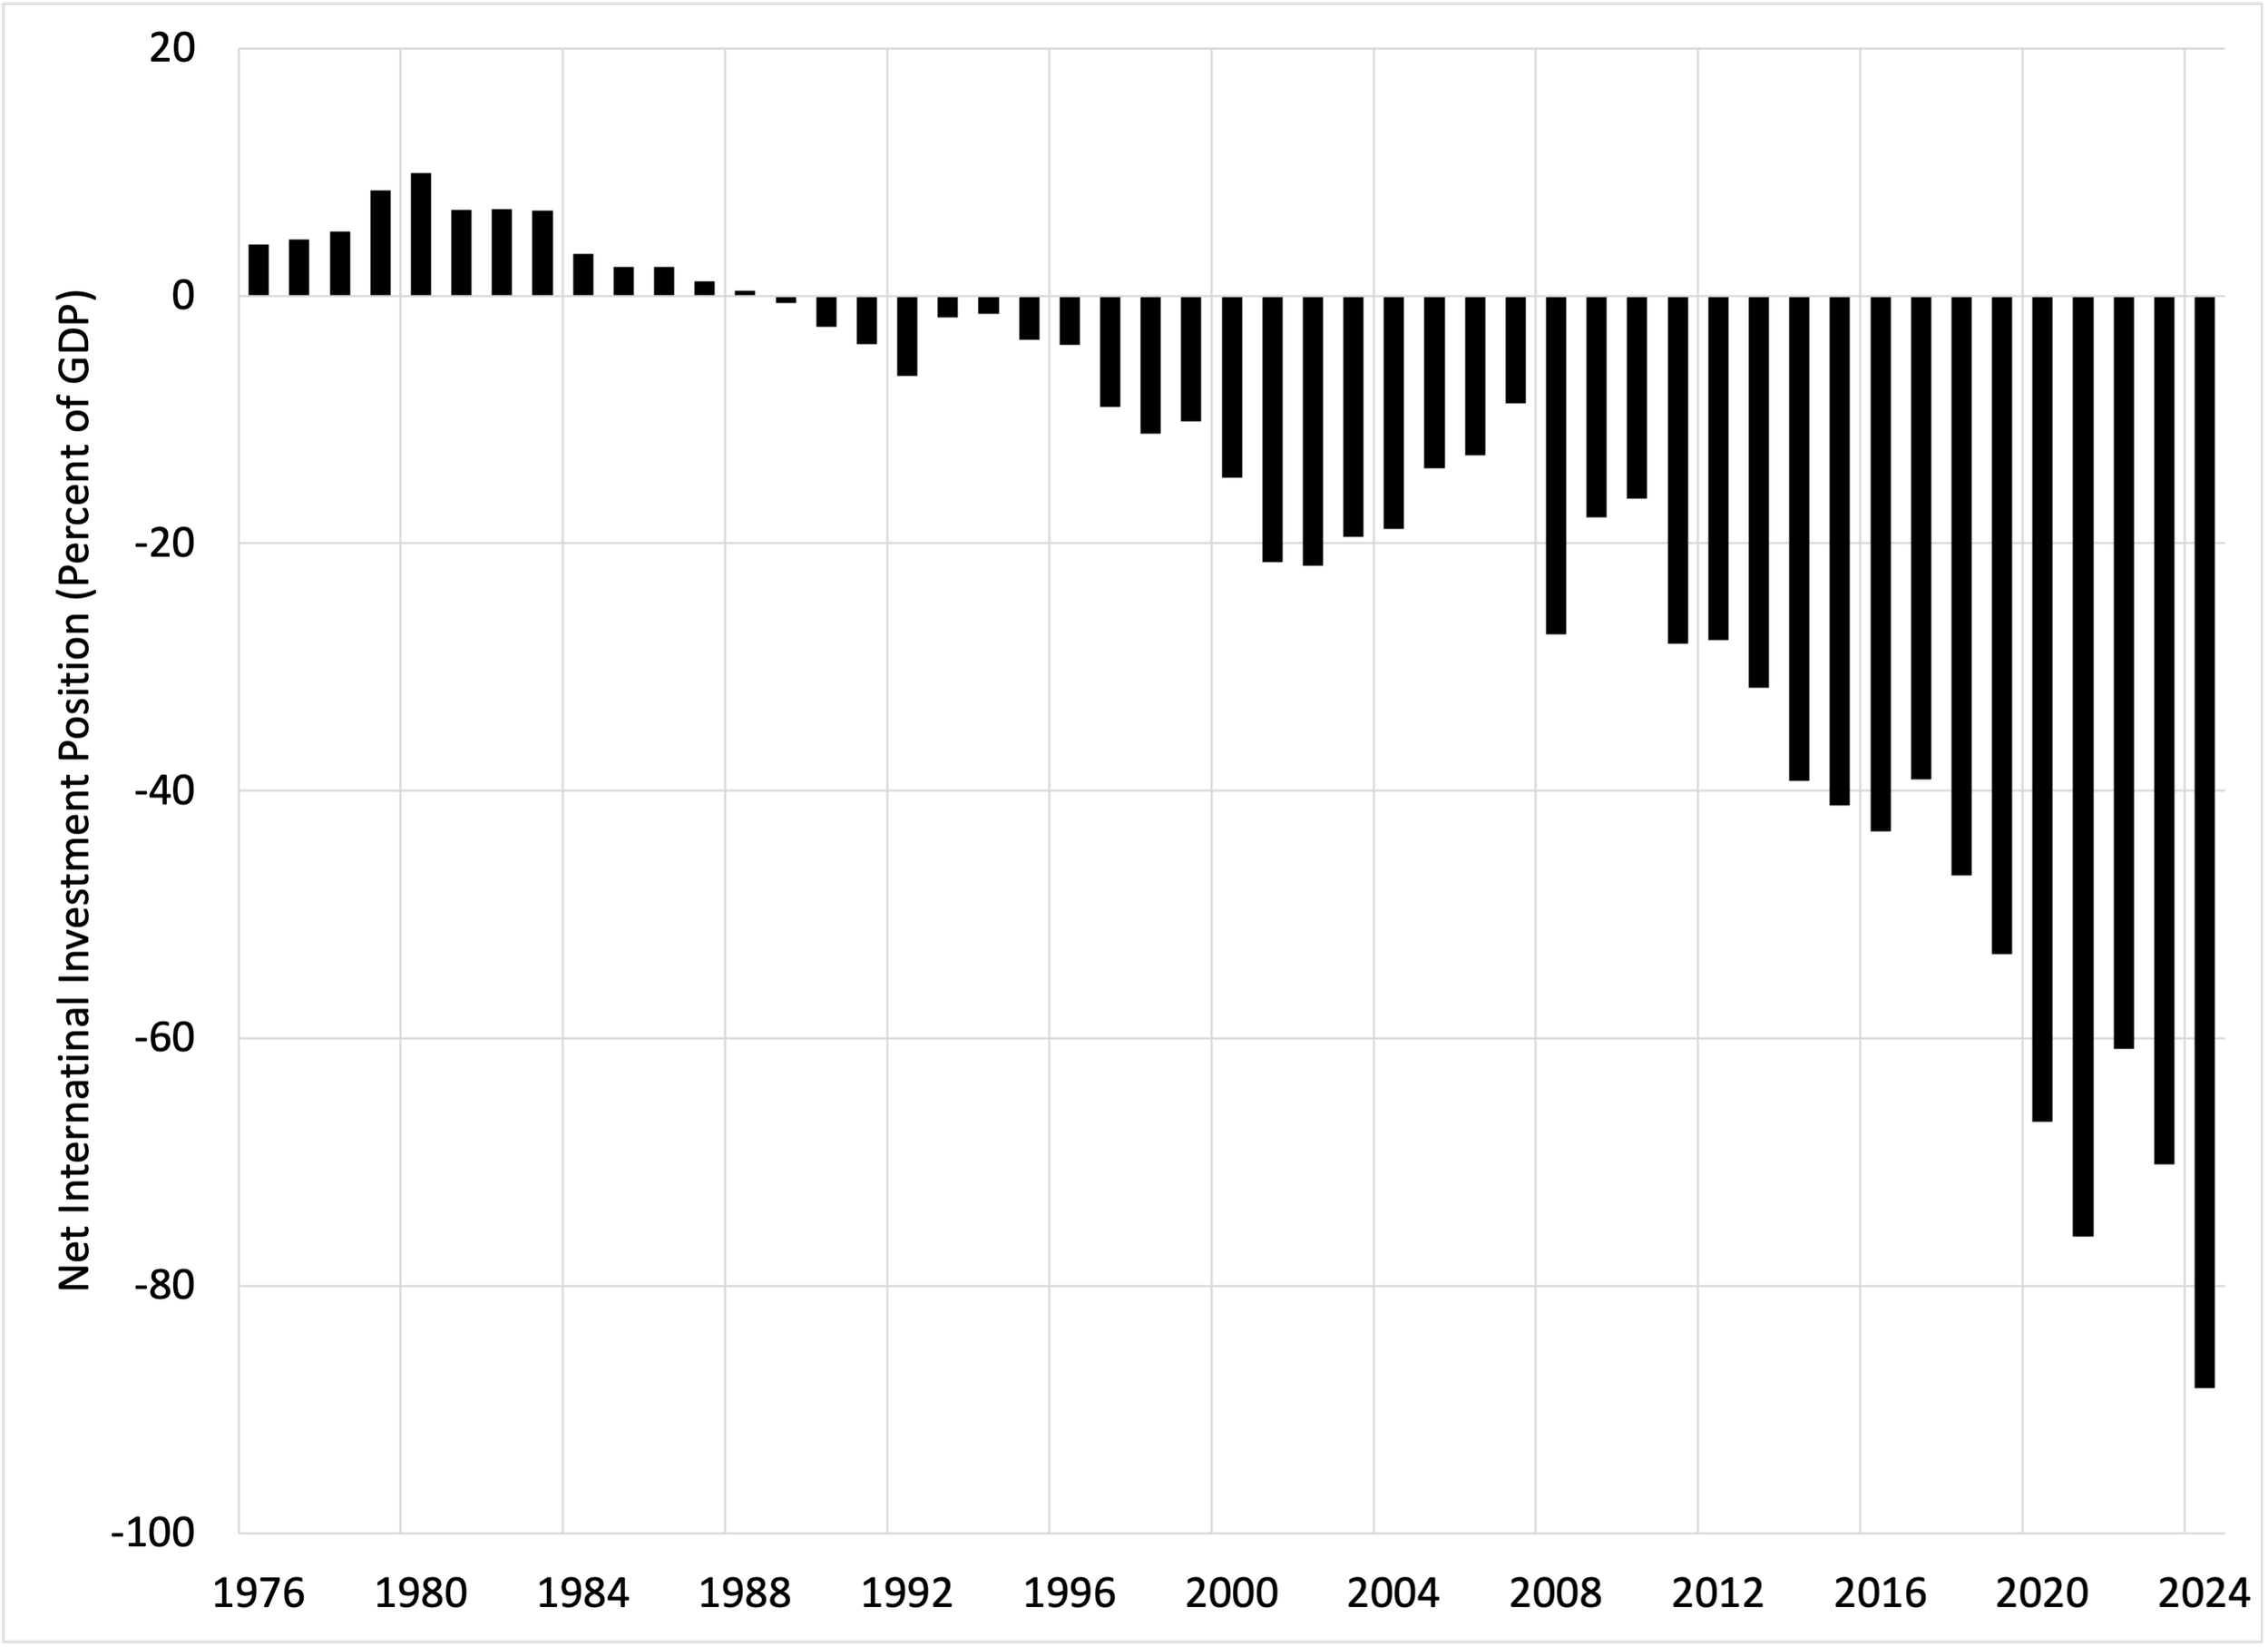
Source: U.S. Bureau of Economic Analysis.
Moreover, the outlook remains for further deterioration of U.S. net foreign liabilities. The IMF projects that the U.S. annual current account deficit will average nearly 3 percent of GDP through 2030 (see red dashed line in the following chart). Leaving aside valuation changes, the flow of annual current account deficits adds one-to-one the stock of net foreign liabilities. This means that unless something changes, by the beginning of the next decade the NIIP will be well over 100 percent of GDP. Any rise in the risk premium paid by U.S. users of funding would push the country further into the red.
At some point, global investors will question how long this unsustainable scenario can persist. When they do, the risk premium they demand for providing funds to U.S. entities likely will rise.
Current Account Balance and Primary Fiscal Balance (Annual, Percent of GDP), 1980-2030P

Notes: The projections from 2024 to 2030 are from the IMF (current account) and the Congressional Budget Office (CBO, primary fiscal balance). The CBO projection (March 2025) assumes an extension of the 2017 tax cuts. The primary fiscal balance is the sum of the overall fiscal balance and net interest payments. Gray-shaded areas denote periods when real GDP fell below-year ago levels. Dashed lines represent projections. Sources: FRED, CBO and IMF.
To be sure, forecasting exchange rates is typically doomed to fail. That said, in the short run, the dollar probably will continue to fluctuate inversely with the tariff rollercoaster. But looking beyond this horizon, three key fundamentals – heightened policy uncertainty, dollar overvaluation, and the prospects for a portfolio shift away from dollar assets – lend considerable credence to private forecasts of a large dollar depreciation. If these projections are correct, a key question is whether the adjustment will be a smooth one. Or, will there be a “sudden stop” where global investors abruptly halt (or even reverse) capital flows into the United States?
The 1980s. To shed light on this question, we can look back at the 1980s. At the time, the “twin deficits” – fiscal and current account – fostered worries about a disruptive end to the prevailing dollar overvaluation (see the first chart). Fortunately, things turned out relatively well. Over the three years starting in early 1985, the real effective exchange of the dollar declined by more than 30 percent without serious financial or economic dislocation. Many observers view that largely benign outcome as a result of international cooperation – focusing especially on the Plaza Accord of September 1985 (see, for example, Frankel).
In our view, however, the orderly dollar depreciation derived primarily from the favorable fundamentals that reduced any incentives for investors to flee U.S. assets and lent credibility to the Plaza Accord. We highlight the three principal conditions that supported the benign outcome.
First, as the NIIP chart highlights, the U.S. net international investment position 40 years ago was positive. Moreover, U.S. gross liabilities were only about 25 percent of GDP. As a result, global investors’ exposure to dollar risk was far lower than it is now. And, the incentive for the U.S. government to consider extreme measures like capital controls to reduce the value of the dollar was essentially nonexistent (see our recent post that addresses potential capital account restrictions going forward).
Second, while some elements of Reagan Administration trade policy were clearly protectionist (including “voluntary” export restraints on Japan and tariffs on semiconductors), there was no widespread application of tariffs and little policy uncertainty. Indeed, the average tariff rate fluctuated in a narrow range from 3.4% to 3.8%. Moreover, President Reagan himself was a strong advocate of free trade (see, for example, here).
Third, after 1983, the Reagan Administration’s fiscal policy became stabilizing. As we explain below, tighter fiscal policy supported ongoing U.S. monetary policy easing, helping to ensure that high inflation would fall.
Today’s fundamentals could hardly be more different: U.S. gross foreign liabilities exceed 200 percent of GDP; tariffs average well over 10% (and their evolution remains extremely uncertain); President Trump does not believe in the benefits of free trade; and, even faced with historically high budget deficits, Congress and the Administration are planning large tax cuts.
Consequently, while dollar overvaluation appears less pronounced today than in 1985, the risks of a disruptive dollar decline – a sudden stop – are much higher than they were 40 years ago. Indeed, without an improvement in fundamentals, it is difficult to imagine credible efforts at international currency coordination.
In our view, the key policy contrast is between the fiscal stabilization of the mid-1980s and the current prospect for high deficits and further rapid debt accumulation. Absent new tariff drama or capital controls, it is the current highly unsustainable fiscal path – and the possible return of 1980s bond market vigilantes – that poses the greatest risk to the dollar and U.S. assets.
U.S. Fiscal Fundamentals: 40 years ago versus Today. To help explain our conclusion, we provide a more detailed comparison of the fiscal fundamentals today with those in the 1980s. To start, note that in 1985, federal debt held by the public sector was 34 percent of GDP. Today, it is nearly 100 percent. And, if Congress extends the 2017 tax cuts, as the Administration proposes, the Congressional Budget Office (CBO) projects that by 2054, the debt ratio will more than double.
But a comparison of debt levels alone is not the whole story. Fiscal behavior in the mid-1980s was far more cautious as well. To see this, we can compare the evolution of the federal primary balance then and now. The primary balance excludes interest payments from the budget balance, so it represents a quantity that fiscal policymakers can choose (if they have the political will).
As the chart above shows, the primary balance (the black line) was slightly positive on average during the 1981-89 period. Moreover, after falling during the early-1980s recession, it improved and then steadied – a pattern consistent with a credible commitment to fiscal stability. In contrast, since 2022, the primary deficit averaged around 3 percent of GDP. And, according to the March 2025 CBO projection, it is likely to stay there for the remainder of the decade (see black dotted line in the previous chart).
We can link the 1980s fiscal developments to the value of the dollar by focusing on the theoretical connection between fiscal policy and the current account. Because the current account is the excess of national saving over domestic investment, it is natural to think of a reduction of the fiscal deficit – which is an increase of government saving – as a way of improving the current account balance (see, for example, our recent post exploring tariffs and the current account). Yet, as we can see in the previous chart, that link is often quite weak. For example, despite the sharp improvement of the primary balance in the 1990s – the Clinton years – the current account balance declined markedly. More broadly, the correlation between the two lines in the chart above is only 0.11. Clearly, other things (like economic growth and investment) can play a big role in moving the current account.
Nevertheless, the Reagan years do exhibit a co-movement between the primary balance and the current account. Put differently, fiscal tightening came with an improvement in the current account, helping to support the value of the dollar. In contrast, there is no reason to expect that the current prospect of unsustainably loose fiscal policy will lead to an improvement in the current account or to support for the dollar.
Another way to see the existing complacency is to compare current and past responses to developments in the overall deficit (including interest payments). Keep in mind that the deficit varies countercyclically, reflecting “automatic stabilizers” that reduce tax collections and increase unemployment benefits in recession. For example, from 1974 to 2019 (excluding the Reagan years), the federal deficit as a percent of GDP moved on average by a bit more than one-for-one with the unemployment rate (see the trend line in the chart below). That is, a one percentage point increase in the unemployment rate was associated with slightly more than a one percentage point increase in the ratio of the deficit to GDP.
It is noteworthy that after the deep recession that ended in 1982, the Reagan era deficits returned to the estimated long-run trendline (see the solid blue dots for the years 1984 to 1989). That is, fiscal policymakers in the mid- to late-1980s acted largely as if they were following a long-run stabilizing fiscal policy rule.
Federal budget deficit (Percent of GDP) and the Unemployment Rate (Annual), 1974-2024

Notes: The dashed line is the fitted line for the period from 1974 to 2019 excluding the Reagan Administration years of 1982 to 1989. The years 1982 to 1989 are highlighted in blue, while the years 2020 to 2024 are highlighted in red. Source: FRED.
The contrast with the post-COVID period is stark. Despite the strong recovery from the 2020 recession, the federal deficit in 2022-2024 remained close to 6 percent of GDP (see the solid red dots in the chart above). Had fiscal policy reverted to its pre-COVID trendline, the deficit today would be less than 1 percent of GDP! Going forward, the CBO now projects overall federal deficits to stay around 6% of GDP for the remainder of the decade.
The bottom line. The second Trump Administration may mark the end of the U.S. exceptionalism that supported an unusually strong dollar. There are no prospects for a return to fiscal sustainability. Optimism about strong U.S. growth is fading. Immigrant entry into the labor force probably already is slowing. As the government slashes funding, key engines of U.S. technological progress – universities and independent research centers – are cutting back sharply. Amid the tariff frenzy and Administration efforts to coerce foreign investment or purchases, businesses are suddenly focused on obtaining preferential treatment, rather than competing and innovating. And, the risk premium on even the safest U.S. assets is increasing (see our earlier post).
These fundamentals do not bode well for a smooth dollar adjustment. Unless domestic policies shift dramatically, both U.S. federal debt and U.S. net foreign liabilities likely will continue to rise markedly faster than GDP. And if, as we expect, higher tariffs do little to shrink the U.S. current account deficit, the risk of even more dramatically disruptive Trump Administration policy interventions – such as outright capital controls – will rise.
Presumably, investors who see these new trends are already reducing their exposure to U.S. risks. The key question is whether a point will come where what now look like gradual portfolio adjustments will turn abrupt.
Acknowledgements. Without implicating them, we thank our friends and colleagues, Richard Berner. Nicholas Sargen and John Lipsky, for their very helpful comments and suggestions.