
The Fed's Reserve Management at a Crossroads
"In my judgment, we should be shrinking the central bank balance sheet, taking the Fed out of these markets unless and until there's a crisis.”
Kevin Warsh, Hoover Institution Interview with Peter Robinson, 8 July 2025.
Whether the Federal Reserve’s balance sheet is big depends on your perspective. The current level of $6.5 trillion is more than six times the level before the Lehman Brothers failure in September 2008. It is also far above the pre-pandemic level of $4 trillion. At the same time, it is $2 trillion below the May 2022 peak of $8.9 trillion. As we noted in our July 2021 post, central bank balance sheets tend to expand sharply during periods of financial stress and do not contract back to their initial level. On occasion, this ratchet has the highly undesirable character of government finance.
Kevin Warsh – the President’s choice to succeed Jay Powell as Chair of the Federal Reserve Board – believes that the Fed’s balance sheet should shrink significantly (see the initial quote). Whether he would like to return to the 2019 level of $4 trillion, or to the pre-Lehman level, we don’t know. Regardless, it raises a fundamental question: How should the Federal Reserve manage its balance sheet, and what are the risks of reducing it significantly from its current size?
To anticipate our conclusions, we believe that the current level is close to the level determined by demand factors in the current regulatory and market environment. Unless there are major changes in the Federal Reserve's operations or in regulatory arrangements, shrinking the balance sheet risks significant interest rate volatility that could undermine financial intermediation and credit provision. Reducing reserve demand by relaxing liquidity requirements could leave the banking system more vulnerable to a panic.
To explain how we reach these conclusions, we proceed in three steps. We begin with a simple supply-and-demand model of the market for reserves that determines the Federal Open Market Committee’s (FOMC) target interest rate. We then turn to the mechanics of reserve management. That is, what determines banks’ demand for reserves, and what are the implications for supply? From this, we can infer the consequences of a significant reduction in the size of the Federal Reserve’s balance sheet. (Note that the FOMC controls the balance sheet for the Federal Reserve System.)
The following chart displays a model of the market for reserves. Under the current monetary policy framework, the Federal Open Market Committee sets a 25-basis-point target range for the federal funds rate, the rate at which banks borrow overnight, uncollateralized, from other intermediaries. The potentially porous ceiling and floor of this corridor are two administered rates. These are the rates on Fed repurchase and reverse repurchase agreements – the rates on the standing repo facility (SRF) and the rate on the overnight reverse repo (ON RRP) facility. In addition, there is the rate that the Fed pays on reserve balances (IORB), which is currently set at 10 basis points below the upper limit of the range. At this writing, the range is 3.50 to 3.75 percent, with the interest on reserve balances at 3.65 percent. Reserve demand, the red line in the figure, has the important property that, as the quantity of reserves increases, it eventually flattens and becomes perfectly elastic (at roughly the IORB, which sets a floor below which banks will not lend).
The Market for Bank Reserves
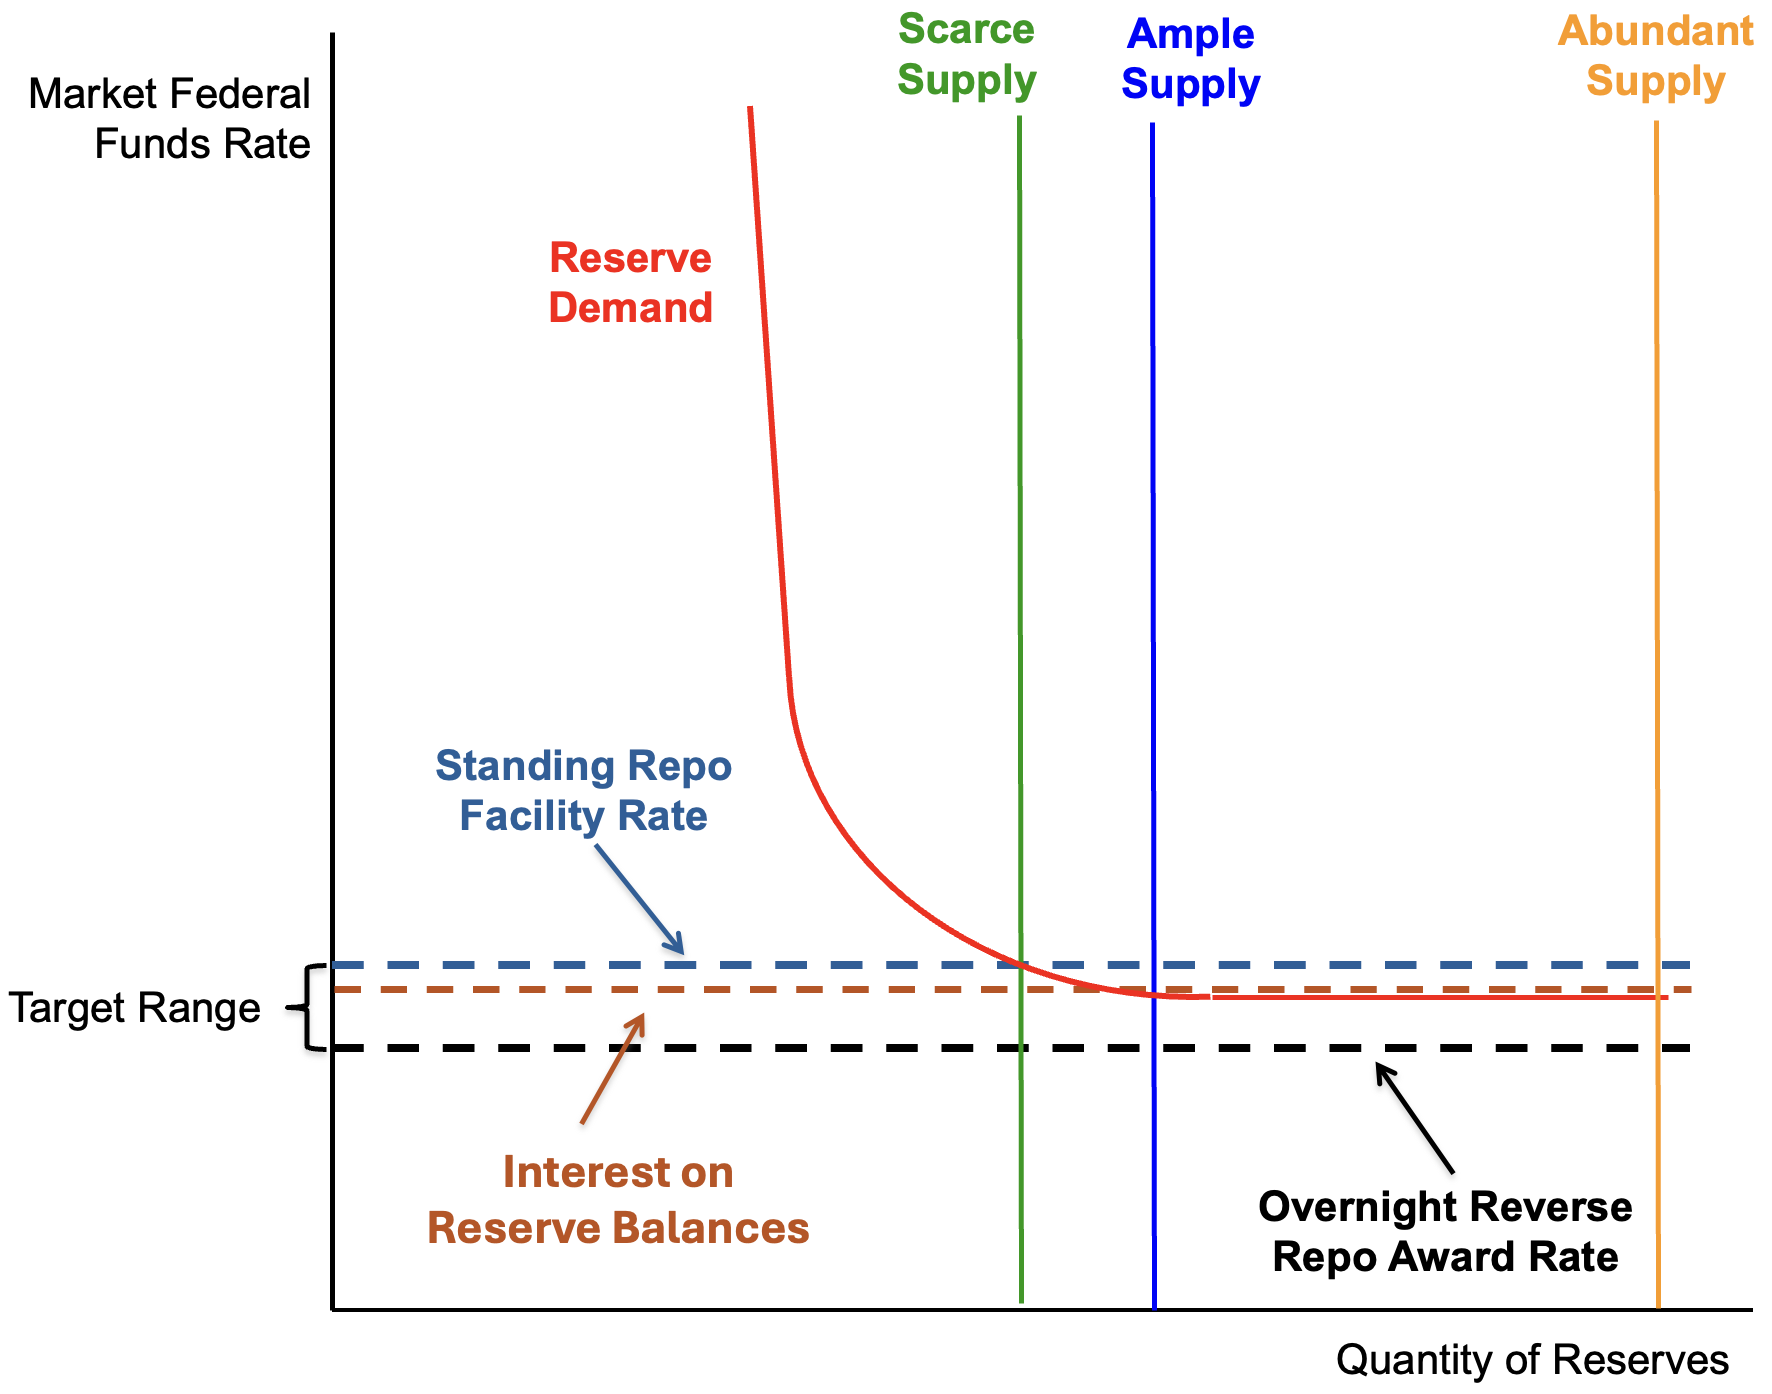
Note: The horizontal portion of the red reserve demand curve is very slightly below the level of the interest on reserve balances. This pattern reflects the usual constellation of interest rates over the past five years.
Turning to reserve supply, following the New York Fed's classification (here), we consider three regions or regimes: abundant, ample, and scarce. Reserves are abundant when the supply curve intersects the horizontal portion of the demand curve far beyond the level at which reserve supply adjustments (up or down) affect the federal funds market rate. This is the orange line.
Next, the ample reserves regime is where the supply curve intersects the demand curve at or very close to the inflection point, where the slope of the demand curve begins to turn negative. At this level, changes in supply may have a small impact, but the primary control of the market federal funds rate remains through the IORB and ON RRP rates administered by the Federal Reserve. This is the bright blue line.
Finally, there is the scarce reserves regime. Here, reserves fall to the point where the supply curve intersects the demand curve at a steep portion of the demand curve (see also Duygan-Bump and Kahn Figure 2 here). This is the pre-Lehman regime in which even small adjustments to supply can generate large movements in the market federal funds rate. To be sure, the Fed could establish a scarce reserves regime even with a relatively large balance sheet, but it has never done so intentionally.
In practice, the Fed manages key dollar short-term interest rates through its SRF and ON RRP facilities. Yet, the Fed continues to discuss interest rate control with respect to the federal funds rate, which has sharply diminished in importance with the decline in use for bank funding. In this residual market, government-sponsored entities (e.g., Fannie Mae and Freddie Mac) are now the primary lenders. And the effective federal funds rate is generally several basis points below the IORB rate – a small gap that reflects the deposit insurance premium banks face should they receive the funds.
As it turns out, there is a relatively straightforward way to determine which regime we are in: we can look at which of the two Fed facilities is in use. Do intermediaries have excess funds that they are placing in the ON RRP facility? Or are they running short and offering securities as collateral at the SRF to obtain reserves? If the ON RRP is in heavy use but no one is using the SRF, short-term market rates likely will be near the corridor floor. We can conclude that reserves are abundant, putting us on the horizontal portion of the reserve-demand curve. Alternatively, if no one wants to place reserves with the Fed, so the volume of ON RRP is very small, and there is modest use of the standing repo facility (SRF), then we are likely in an ample-reserves regime, with short-term rates likely varying within the corridor. Finally, when intermediaries use the SRF extensively, and there is no reverse repo, we may reasonably conclude that reserves are scarce, with market rates testing the corridor ceiling.
The following chart shows the extent of the Fed’s reverse repo (black) and repo operations (red) since the beginning of 2019. To be clear, before the establishment of the SRF on 28 July 2021, Fed repo provision operated on an ad hoc basis. The figure suggests three periods that differ by the pattern of supply. From mid-September 2019 through the beginning of the pandemic in early March 2020, Fed repo provision was substantial, ranging from approximately $20 to $60 billion. Then, from mid-2020 to August 2025, Fed repo disappeared, while intermediaries brought their excess funds to the ON RRP. More recently, use of the SRF dwindled, while Fed repo provision picked up modestly. From this, we may conclude that there were two periods of ample reserves and one of abundant reserves.
Federal Reserve’s repo and reverse repo facilities (Daily), January 2019 to Feb 2026
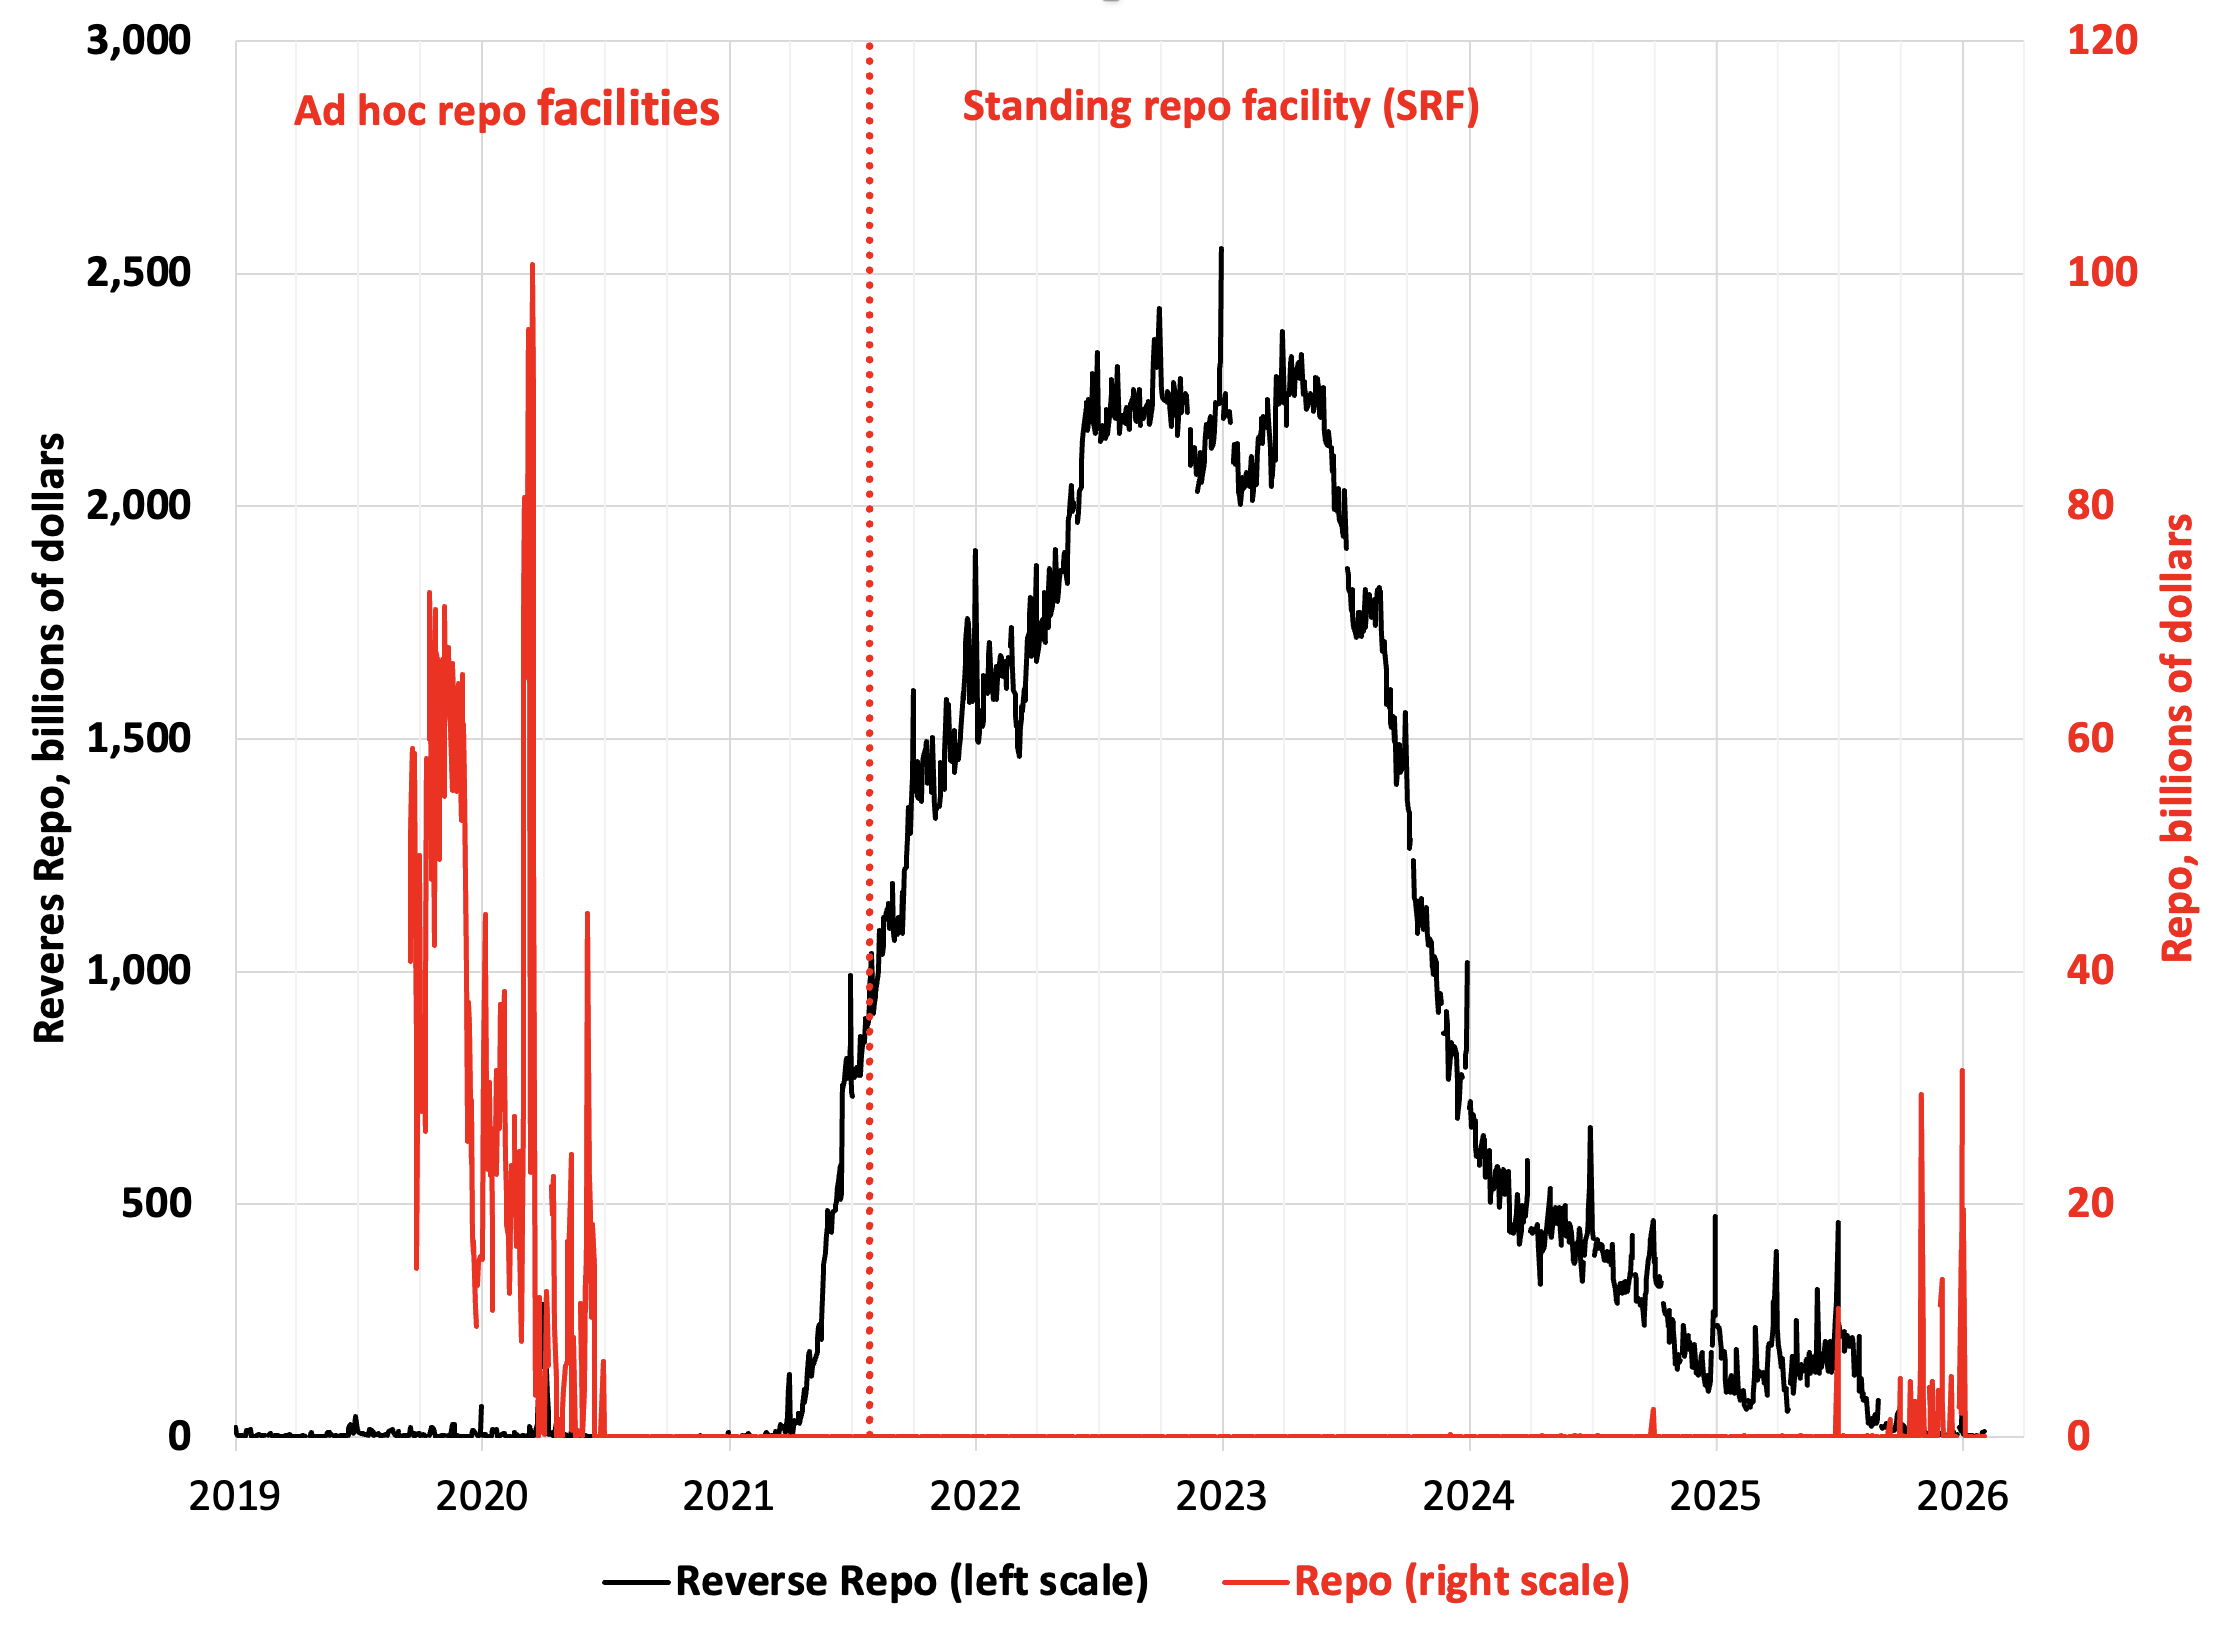
Note: The red line (quantity of repo) obscures very small amounts of reverse repo in the latter part of 2025. Source: FRED.
As one would expect in a regime with ample reserves, the current balance sheet is likely close to the inflection point in the demand curve in our first diagram. Looking ahead, because both currency and banks’ demand for liquidity tend to grow over time, maintaining the status quo would require that the balance sheet expand at least slowly. Put slightly differently, measured as a percent of GDP, the balance sheet has receded to 21.5 percent of GDP, only slightly above the end-2019 level. As GDP rises over time, maintaining this ratio eventually will require relatively permanent (as opposed to temporary) net purchases of securities, and that appears to be what policymakers now anticipate. According to the latest FOMC implementation note, the instructions to the manager of the system open market account (the Fed’s balance sheet) are to “[i]ncrease the … holdings of securities through purchases of Treasury bills and, if needed, other Treasury securities with remaining maturities of 3 years or less to maintain an ample level of reserves.”
It is worth noting that other central banks employ monetary control strategies that are comparable to that of the Fed. For example, both the Bank of England and the Eurosystem set administered rates to influence market interest rates. Both currently operate with abundant reserves, which push market rates to the target floor. Like the Fed, both central banks expanded their balance sheets sharply over the past 15 years.
If the FOMC wishes, it can surely shrink its balance sheet, returning to a regime in which reserves are scarce. But unless the Committee is willing to accept potentially damaging increases in the volatility of short-term interest rates, it would be difficult (see Duygan-Bump and Kahn Figure 3 here). First and foremost, policymakers would need to address banks’ structural demand for reserves that is much higher than in the pre-Lehman world. Second, they may have to abandon the somewhat porous corridor system: if they leave in place the facility that supplies reserves at the top of the interest-rate band, banks seeking to acquire reserves may compel the Fed to accept balance sheet expansion. We will discuss each of these in turn.
The rise in banks’ reserve demand since the pre-Lehman period reflects changes both in their internal liquidity risk management and in bank regulation – namely, the 2015 introduction of the liquidity coverage ratio (LCR). The LCR, part of the post-crisis Basel III reforms, requires banks to hold sufficient high-quality liquid assets (HQLA) – primarily reserves and U.S. Treasury securities – to meet net cash withdrawals over a 30-day stress scenario. To satisfy the HQLA requirement, banks prefer to hold reserves (rather than Treasuries) for at least two reasons. First, they do not wish others to see them selling U.S. Treasury securities during a stress period, as sizable sales could signal distress. Second, while they could use Treasuries as collateral to borrow from the Fed, they remain hesitant to do so – again, to avoid the perception that they are in trouble.
It may be possible to change this behavior – and to do it without easing liquidity requirements. One way is for the Fed to make discount borrowing more palatable to banks. There are numerous proposals to make the discount window a routine part of banks’ day-to-day liquidity management. For example, the Fed could routinely leave the system short of supply and compel banks to borrow to meet the marginal demand. Alternatively, the Fed could count discount borrowing capacity in its computation of liquidity requirements (see discussions here and here). Whether these mechanisms would be sufficient to overcome the powerful stigma associated with borrowing from the central bank (especially in a crisis) is far from certain.
A second possibility is to give banks an incentive to substitute Treasury securities for reserves. For example, the Fed could simply revert to a system in which the interest on reserve balances (IORB) is zero. This is the pre-Lehman world in which banks aimed to hold $40-$45 billion in reserves – less than 2 percent of what they hold now (see here). To make that pre-Lehman scarce reserves regime work, the Federal Reserve forecasted daily fluctuations in reserve demand, supplying what they thought the system needed each morning.
As we have suggested, to establish a regime with scarce reserves and a small balance sheet, the FOMC likely would have to abandon the corridor system that currently limits fluctuations in the federal funds market rate. Unless the Fed were to eliminate the SRF, banks would borrow there to obtain the reserves they want, almost certainly far exceeding the daily “scarce reserves” supply target and undermining the Fed’s small balance sheet goal. But without the SRF to cap short-term money market interest rates, these rates could spike frequently and without warning.
This pattern of market instability is exactly what occurred in mid-September 2019 before the advent of the SRF: when reserve demand suddenly exceeded scarce supply, a key short-term interest rate, the secured overnight finance rate (SOFR), spiked to 5.25 percent – a full 3 percentage points above the top of the FOMC’s target range at the time (see here). Had the Fed not responded, the interest rate spike and the associated loss of confidence in monetary control could have undermined financial intermediation and the provision of credit. To stabilize the market, the Fed had to rapidly expand repo supply. The effects of this expansion are visible on the left-hand side of the figure above. In sum, if the Fed’s balance sheet is not sufficiently flexible, short-term interest rates will not be stable.
As if this isn’t difficult enough, the behavior of the Treasury’s General Account further complicates any effort by the FOMC to shrink its balance sheet dramatically. The Federal Reserve operates as the banker for the U.S. Government, with the Treasury’s account at the Fed playing the same role as a personal checking account. Tax revenue and proceeds from the sale of Treasury securities come in, and expenditures for all government programs go out. These flows are enormous. In an average month, revenues are approximately $400 to $500 billion. Since the government runs a persistent deficit, expenditures average about $100 billion per month above that level. Fluctuations in the account balance directly translate into changes in reserves. The reason is simple: when private banks receive or pay funds to the federal government, they transfer funds between their reserve accounts and the Treasury general account.
Over the past five years, the Treasury general account fluctuated between $50 billion and $984 billion. Congressional delays in raising the federal debt ceiling and seasonal fluctuations in tax revenues drive the largest swings. When reserves were abundant, this caused virtually no complications. Instead, these fluctuations led to movements into and out of the ON RRP facility (see the black line in the chart above). That is, as Treasury balances decline and reserves increase, intermediaries place the funds with the Fed. And, as the Treasury balance rises, the placements in the ON RRP facility fall. (The correlation between the level of overnight reverse repo and the general account is -0.65.)
Where does this leave us? First, a reduction in the size of the balance sheet to pre-pandemic levels – by $2 trillion or more – can occur only if banks’ structural demand for reserves declines. Second, keeping the balance sheet small likely requires abandoning the corridor system, eliminating the SRF facility and possibly the ON RRP facility as well. Third, with a small balance sheet and scarce reserves, even small movements in demand (or supply) that the Fed fails to accommodate immediately could result in large, unanticipated swings in short-term money market interest rates. Such uncertainty would almost surely diminish banks’ willingness to extend credit.
We appreciate that when a central bank's balance sheet is large, it facilitates government financing that is highly undesirable (see our recent primer on fiscal dominance). It also interferes with the effective function of financial markets. Yet, shrinking the balance sheet significantly would expose short-term markets to substantial volatility risk - a cure potentially worse than the disease.
Given these challenges, we would expect the Fed under a future Chair Warsh to tread very carefully in seeking to realize his balance sheet goals.
Acknowledgement. We thank our friend and NYU Stern colleague, Richard Berner, for very helpful suggestions.