

"With the implementation of “know your client” rules, anti-money laundering efforts, and so on, it has become increasingly difficult to have an efficient payments system. Many banks have retired from the business, for example, of handling remittances, which are a very important source of income for many emerging markets.” Guillermo Ortiz, Interview, 19 March 2015.
When migrants send money across borders to their families, it promotes economic activity and supports incomes in some of the poorest countries of the world. Annual cross-border remittances are running about US$600 billion, three quarters of which flow to low- and middle-income countries. To put that number into perspective, total development assistance worldwide is $150 billion. Indeed, for many countries, these transfers account for a significant fraction of people’s incomes. For example, in Guatemala, the Philippines and Senegal, remittances exceed 10 percent of GDP.
Yet, despite the remarkable technological advances of recent decades, remittances remain extremely expensive. In an earlier post, we extolled the virtues of domestic payments systems like Zelle, an inexpensive, bank-run means for person-to-person transfers up to several thousand dollars. The marginal cost of using Zelle is zero. That is, for customers of the bank, there is no charge.
Cross-border remittances are far from costless. On average, the charge for sending $200―the benchmark used by authorities to evaluate cost―is $14. That is, the combination of fees (including charges from both the sender and recipient intermediaries) and the exchange rate margin typically eats up fully 7% of the amount sent. It is less expensive to send larger amounts, with the global average cost of sending $500 at just under 5%. Even so, the aggregate cost of sending remittances in 2017 was about US$30 billion, roughly equivalent to the total non-military foreign aid budget of the United States!
In this post, we discuss remittances, why their costs remain high, and what might be done to lower them.
We start with a quick look at some data. The first chart below shows that the inflation-adjusted volume of remittances exploded over the past two decades. Today, these flows are triple what they were in 2000 and five times what they were in 1990. Furthermore, the economic importance of inward remittances has increased for low- and middle-income countries, rising from an average of 1.2% of GDP in 1990 to 1.6% of GDP today.
Aggregate volume of remittances (Billions of 2017 U.S. dollars), 1970-2017

Note: Inflation-adjusted sum of country-specific remittance flows. Source: World Bank.
You might think that this massive increase in volume either reflects, or promotes, cost-reducing advances in remittance technology. But, as the next chart shows, costs have trended lower only gradually, and with considerable differences across types of transfer agents and across sender countries. The red line is the simple, unweighted average for all providers—banks, money transfer operators (MTOs, including fintech companies) and post offices—of sending $200 from the full sample of 48 sending countries. Over the past decade, this global average has fallen from 9.8% to 7.1%. However, in the case of MTOs (the dashed, black line), like Western Union, the cost has stagnated in recent years, after falling by 2½ percentage points before 2014. And, in the United States (the blue line), the cost has declined only very modestly, falling from just over 7% in 2009 to roughly 6%, where it has stayed since 2014. That the U.S. cost is persistently below the global average likely reflects the less-developed financial systems included in the global sender sample.
Importantly, remittances are a very profitable business for large operators. Western Union, for example, completed 268 million customer-to-customer transfers in 2016, with a value of $80 billion. Total revenue for the year exceeded $5 billion, with net profits surpassing $250 million.
Average Cost of Sending US$200 Across a Border (Percent of Total), 2008-17

Note: The red and black lines show the evolution of the average cost of sending funds from any one of 48 sending countries to any of 105 receiving countries in the sample. The data include a total of 365 country pairs (or corridors). The blue line shows the cost of sending from the United States. Source: World Bank.
Drilling down to the corridor level (that is, to specific country pairs), remittance costs vary considerably, but still strike us as high in most instances. Take the benchmark case of sending US$200 or the equivalent. The average cost of a transfer from the United States to Mexico is $8.91; from Germany to Turkey, it is $12.83; and from South Africa to Botswana, the cost is a whopping $36.60.
Even for a specific corridor, the cost varies substantially. For example, someone wishing to send US$200 from Italy to Morocco would pay anywhere from $1.93, if they were able to use the internet service of Transferwise, to $14, if they went to Banca Monte dei Paschi di Siena, a commercial bank. Using a Western Union agent would cost $10.17. While the speed of the transfer varies somewhat, the vast majority of services provide funds the next day or sooner. (You can find and compare prices for all 365 corridors on the World Bank’s website here. The full data set, including a breakdown of costs and information on transfer speeds, is available upon request here.)
As mentioned, the aggregate cost of these transfers is now roughly US$30 billion per year. While the direct cost is borne by the migrant senders and their family recipients, there is a sense in which the burden also falls on poor countries as a whole. The reason is that remittances enhance growth in poor countries by providing alternative means for financing investment where transactions costs are high (see Guilano and Ruiz-Arranz). That is, we can think of policies that make remittances easier and cheaper as a means to boost capital formation and productivity in receiving countries.
Against this background, in July 2009 the leaders of the largest advanced economies (G8) pledged to reduce the cost of remittances to 5 percent – a commitment endorsed by the G20 in 2011 and again in 2014, and included in the UN’s Sustainable Development Goals in 2015. After eight years, the global average is roughly half-way there. What can be done to lower remittance costs further?
There are two major mechanisms for reducing costs: education and competition. On the first, what if customers become sufficiently well informed that they use only the cheapest available services? To answer this question, the World Bank has computed what they call the Smart Remitter Target (SmaRT). This competitive benchmark is the average of the three lowest cost remittance service providers (RSPs) in each corridor. At the end of 2017, the global SmaRT average was 5.17%. This means that a process of education alone might be sufficient to reduce the average cost by as much as 2 percentage points. (In 2011, the World Bank started an education program called Greenback 2.0 aimed at increasing the efficiency of the market for remittances.)
Turning to competition, Beck and Martínez Pería conclude that corridors with more migrants and more competition exhibit lower costs. Importantly, over one-half of all remittances are paid to persons in just 10 countries (see below). However, where banks’ share in the business is high, costs are high as well. In fact, in the December 2017 issue of Remittance Prices Worldwide, the World Bank reports that remittance costs vary substantially by the instrument used, with transfers using cash and bank accounts costing 7%, much more than the 4.2% average cost of using mobile money. It appears that expanding mobile technology (and displacing banks) will help squeeze remittance costs.
Top 10 Countries for Inward Remittances (Billions of Dollars), 2017
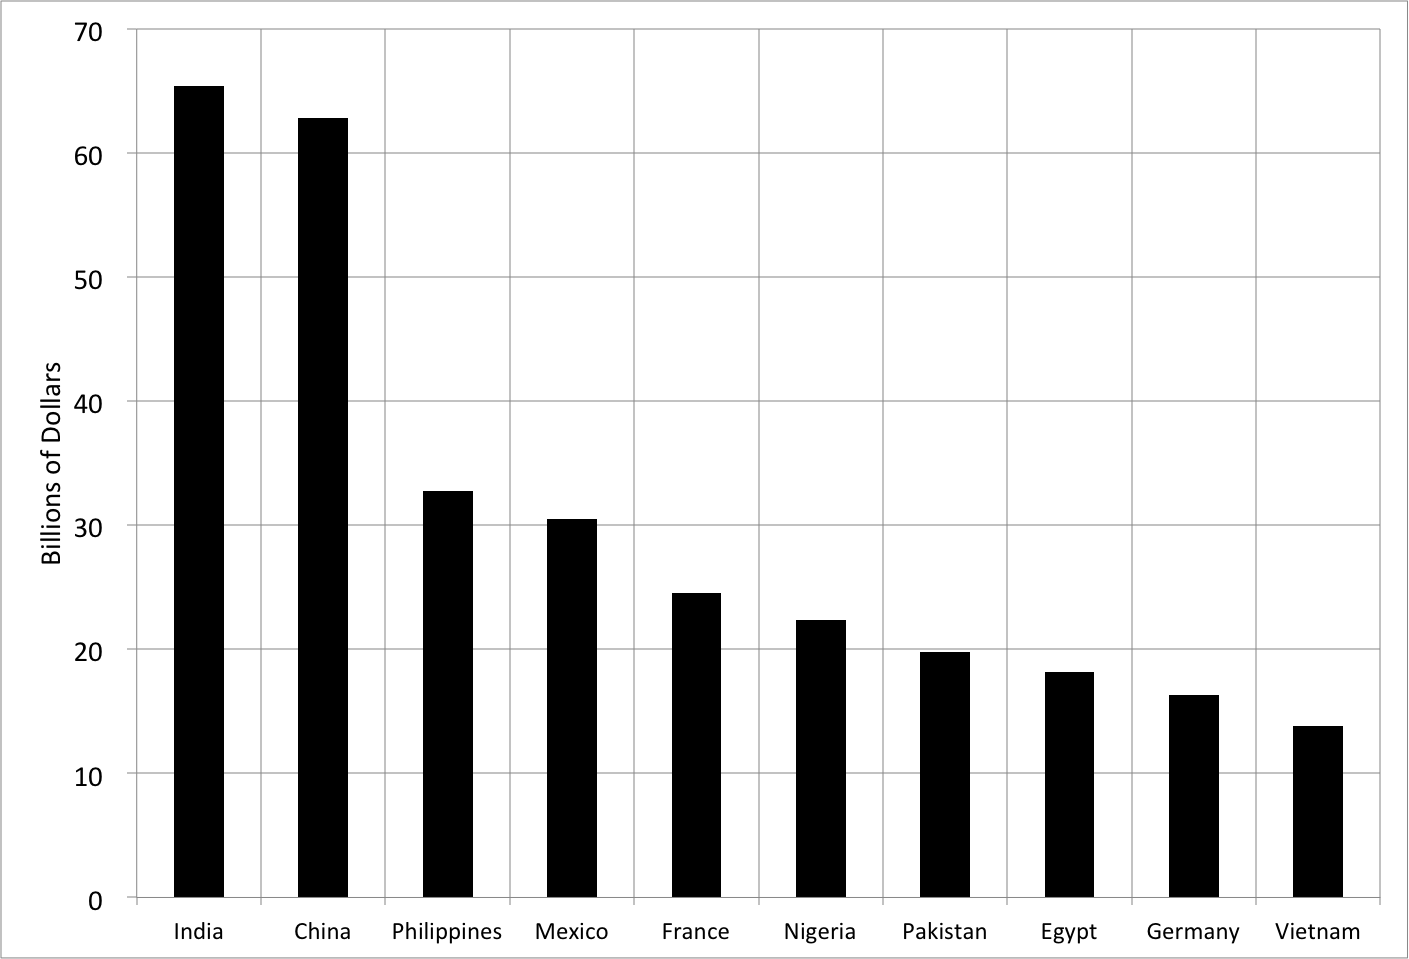
Source: World Bank.
But, as Guillermo Ortiz suggests in the quote above, a key challenge looms. Most forms of cross-border funds transfer require the cooperation of a bank at some point in the process. An MTO, for example, needs accounts at banks on both ends of the transfer corridor. However, in response to stronger anti-money-laundering (AML) standards, banks have been terminating or restricting their relationships with MTOs (see here).
From the perspective of a bank, mobile payments create similar risks. As is the case for virtual currencies like Bitcoin, mobile payments systems can be used to conceal nefarious activities (see here). Meeting the Know Your Customer (KYC) standards that banks demand (and governments expect) is expensive. As a result, these factors may continue to throttle the speed with which cost-competitive technology firms make inroads into the remittance business.
That said, the goal of reducing the cost of small remittances to 5% is clearly within reach. And, efforts to streamline the KYC/AML process (including through the use of legal entity identifiers) could get us there (and beyond) faster.