
Thoughts on Deposit Insurance
“If we require that financial institutions pay in good times for the guarantees they receive ex post, in all likelihood, this will organically cause financial firms to no longer take unsound risks.” Viral Acharya and Matthew Richardson, “Government Guarantees: Why the Genie Needs to be Put Back in the Bottle,” The Economists Voice, November 2009.
“The FDIC charges premiums based on the risk that the insured bank poses, and it inspects, or examines, banks further to manage that risk.” Diane Ellis, “Deposit Insurance Funding: Assuring Confidence,” FDIC Staff Paper, November 2013.
Government guarantees have become the norm in the financial system. According to the latest Federal Reserve Bank of Richmond (2017) estimate, the U.S. government’s safety net covers 60% of private financial liabilities in the United States. We suspect that this is an underestimate: for example, Richmond’s “bailout barometer” does not include money market mutual funds, which have now been rescued twice (in 2008 and 2020) by the Federal Government.
Serious underpricing of government guarantees gives intermediaries the incentive to take risk that can threaten the entire financial system. The Great Financial Crisis of 2007-09 is the most obvious case in point. Because of implicit guarantees, the government-sponsored enterprises (GSEs) could finance themselves at tiny spreads over Treasury debt, allowing them to become highly leveraged and encouraging them to backstop risky, poorly documented mortgages (see Acharya et al.). The perception that the largest, most complex, most interconnected intermediaries were too big to fail gave them similar incentives, necessitating large government capital injections following the Lehman bankruptcy in 2008.
Deposit insurance is arguably the oldest and most widespread form of government guarantee in finance. In the United States, Congress established the Federal Deposit Insurance Corporation (FDIC) at the depth of the Great Depression in 1933 to help prevent bank runs. The lawmakers’ motivation is notable: they acted only after the Federal Reserve had disastrously failed to perform its function as lender of last resort (LOLR), allowing the failure of thousands of banks after 1929. Put differently, government insurance protects deposits automatically without relying on a discretionary LOLR. Today, more than 140 countries have some type of deposit insurance scheme.
From the 1940s through the 1970s—what Gary Gorton calls the “Quiet Period” of the U.S. financial system—the expanded federal safety net (including both deposit insurance and the LOLR) helped ensure the stability of the banking system. But, bank failures picked up markedly first in the 1980s—peaking in the latter part of the decade—and again in the crisis of 2007-09. The return of widespread instability generated record losses for the FDIC (see chart). (The disruptions were even greater for thrifts: from 1980 to 1994, the crisis halved the number of savings and loans and bankrupted their then-federal insurer, FSLIC.)
Number of banks failed and estimated losses of the deposit insurer (billions of dollars), 1935-2020

Note: As of 1990, the data cover banks and thrifts; prior to 1990, only banks are covered. According to the FDIC’s historical statistics on banking, including thrifts raises the peak number of failures in 1989 to 530 institutions, more than double the displayed peak for banks.
Source: FDIC Annual Reports of 2020 and 2005.
In this post, we briefly review the evolution of FDIC deposit insurance pricing. We highlight evidence that, largely because of Congressional mandates, the federal insurance guarantee was underpriced for many years. It is not until 2011, following the crisis of 2007-09, that the FDIC introduced the current framework for risk-based deposit insurance fees, bringing insurance premia closer to what observers would deem to be actuarially fair.
Going forward, as with any insurance regime, keeping up with the evolution of bank (and broader financial system) risks will require a willingness to update the deposit insurance pricing framework from time to time. That means adjusting pricing to reflect both the range of bank risk-taking at a point in time and—to ensure the sustainability of the deposit insurance fund without taxpayer subsidies—the evolution of aggregate risk.
Pre-Crisis Deposit Insurance Pricing. So, how did deposit insurance pricing evolve since the FDIC began operating 87 years ago? What follows is a summary largely based on the FDIC staff surveys by Garnett, Henry, Hoople, and Michalik (2020) and Ellis (2013). In focusing on the FDIC, we leave to one side issues related to the collapse of the savings and loan system in the mid-1980s.
From the FDIC’s start in 1934 until 1991, Congress mandated the imposition of a flat premium rate—starting at 8.3 basis points on domestic deposits—for all banks regardless of their default probability or their risk-taking propensity (see the dashed red line in the following chart, right axis). Aside from the risk-insensitive premium, using domestic deposits as the assessment base means that—as short-term funding mechanisms like repurchase agreements and securities lending developed in recent decades—banks began to have scope to avoid the insurance fee by substituting other forms of liabilities.
FDIC deposit insurance fund (percent of insured deposits) and the assessment rate (basis points)
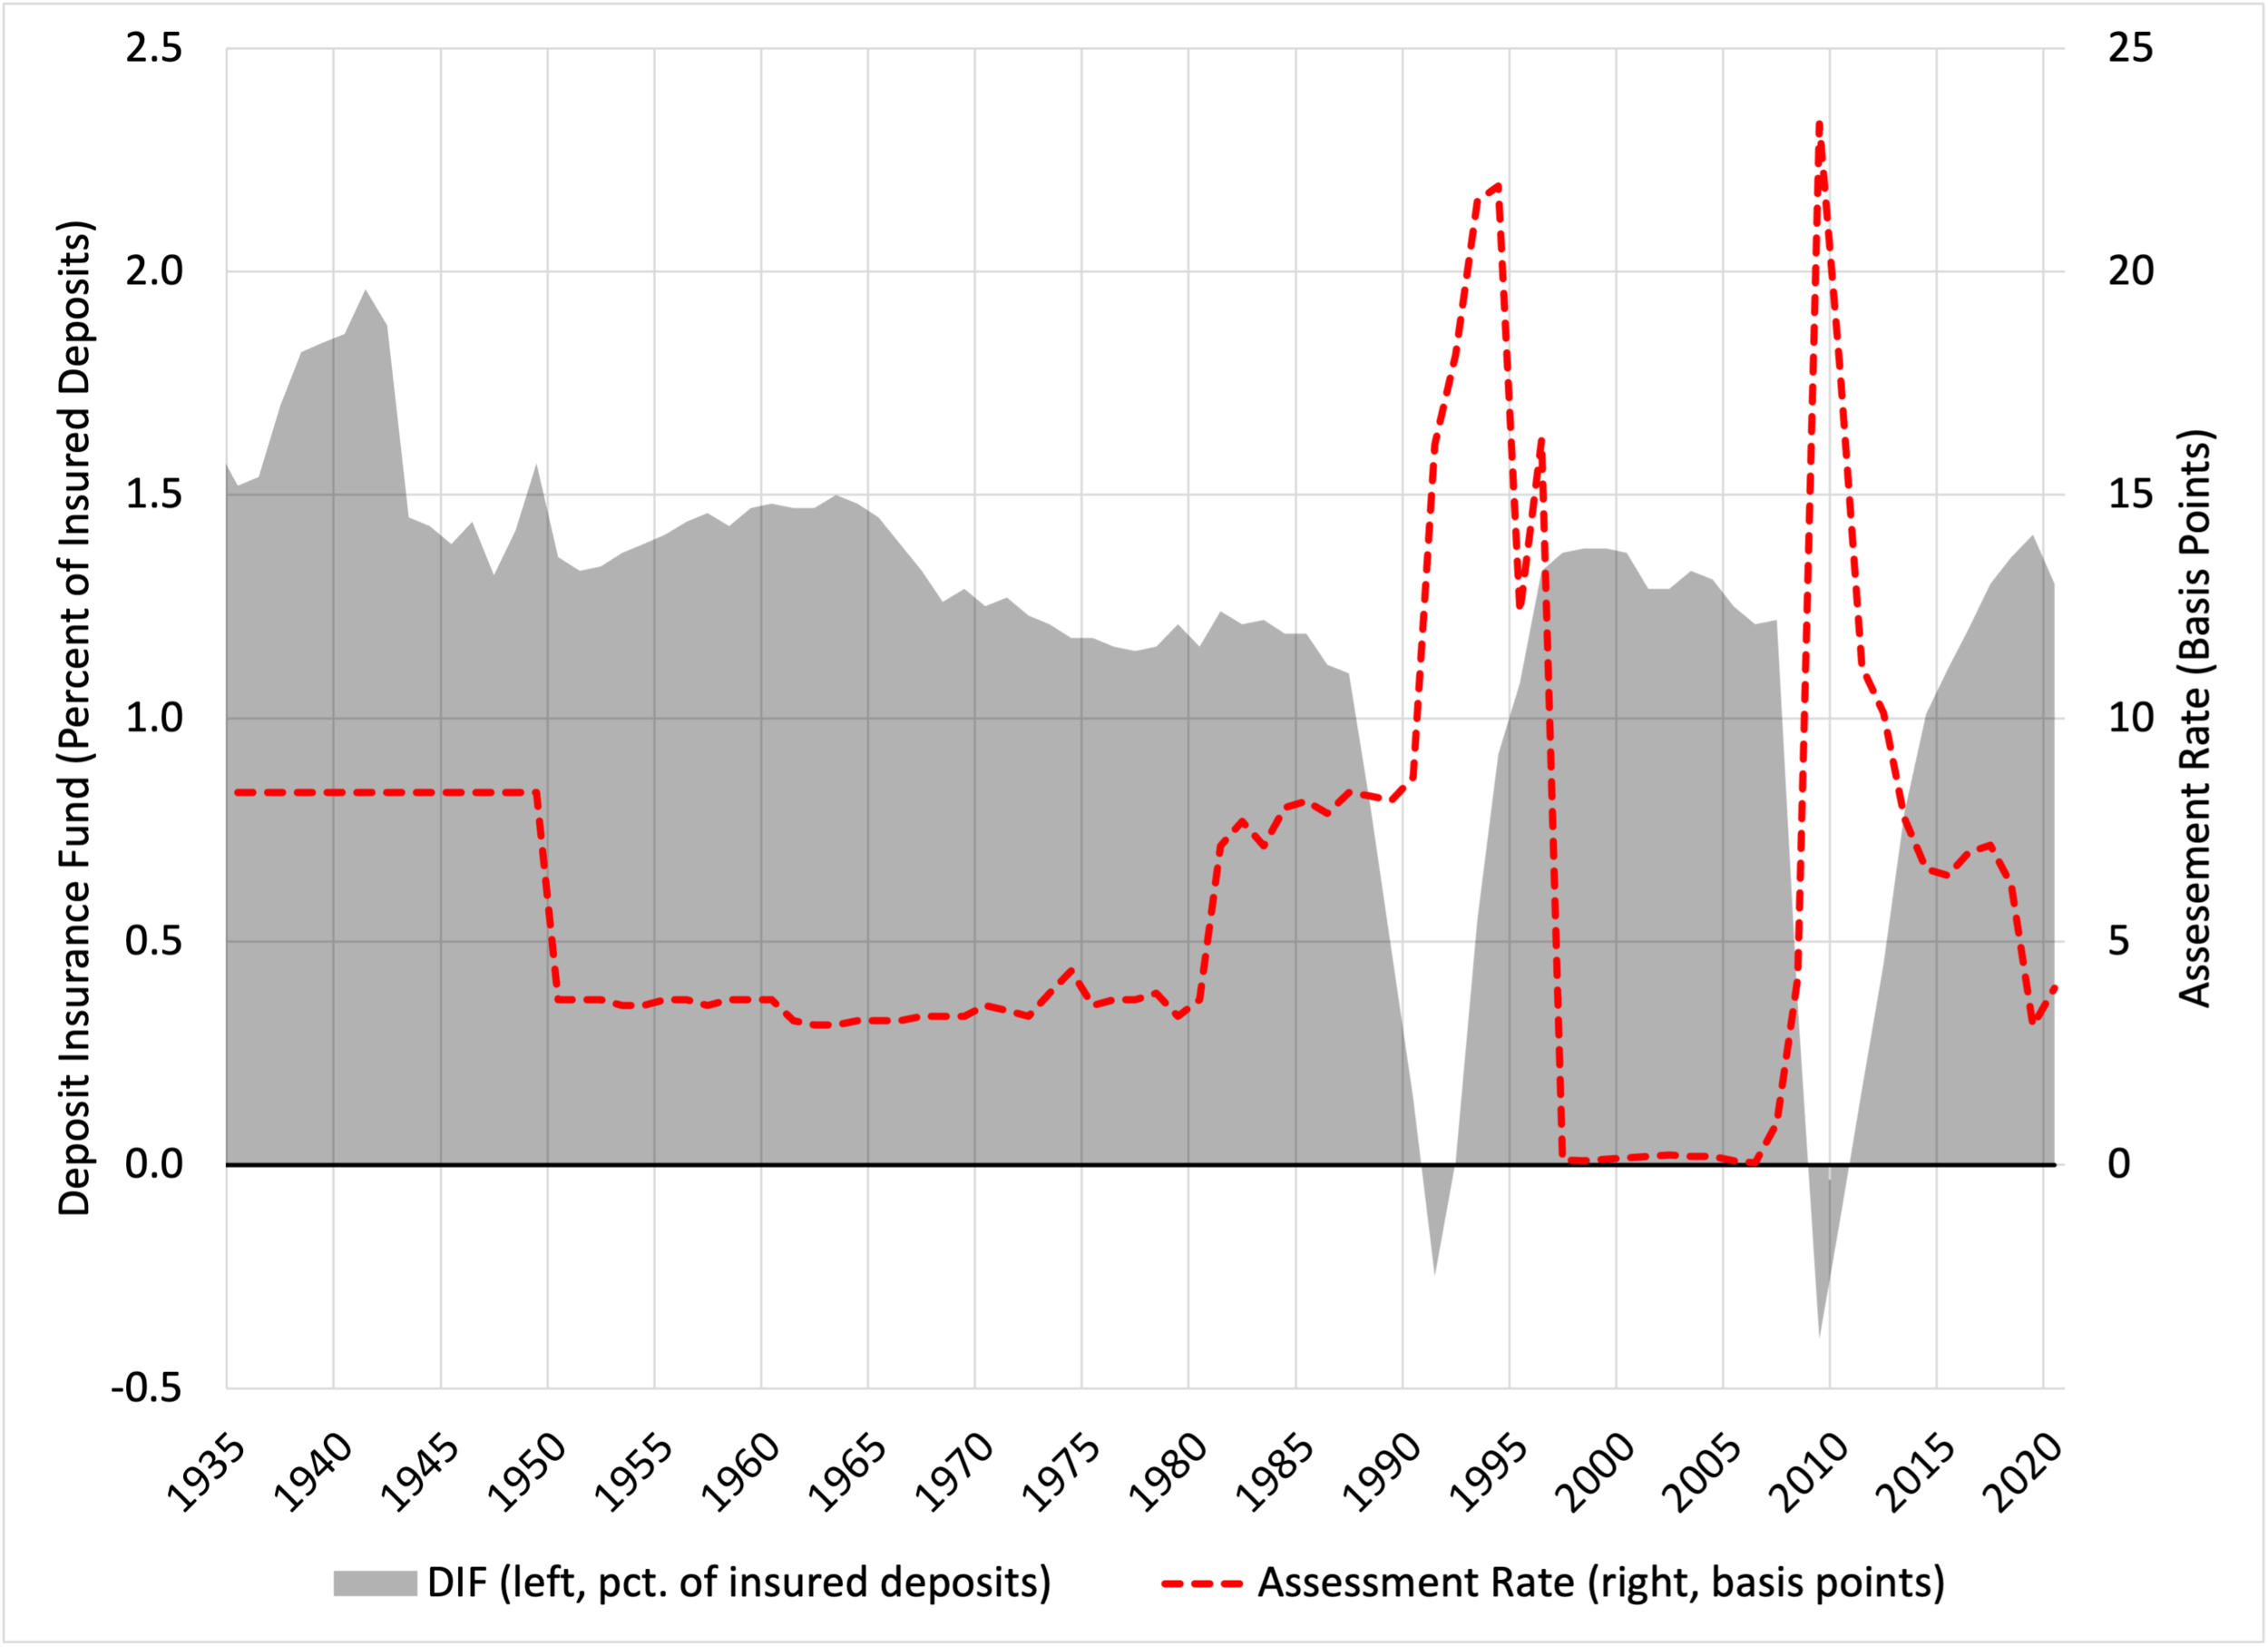
Source: FDIC Annual Report 2020.
From 1950 to 1980, the effective insurance charge declined to about 3 basis points, consistent with a largely stable deposit insurance fund (DIF) shown as the shaded gray area in the chart above (left axis). However, circumstances changed in the 1980s, as the surge in bank failures (see first chart) boosted resolution costs and depleted the insurance fund (see chart above). When the DIF balance turned negative in 1991, the FDIC responded in two ways. First, using its statutory authority, it borrowed from the Treasury to fill the hole. Second, it sharply raised its assessment rate to restore the DIF to a statutory minimum level (established in 1989) equal to 1.25% of insured deposits. (It is worth noting that the level of insured deposits substantially understates effective insurance, because the FDIC often relies on a purchase-and-assumption resolution method—which covers all deposits—rather than a payout scheme—which covers only insured deposits.)
Following authorization under the Federal Deposit Insurance Improvement Act (FDICIA) of 1991, the FDIC tiptoed into risk-sensitive pricing in 1993. Initially, they set narrow differences in premia across banks with very different risk profiles. These premia ranged only from 23 basis points for most banks—designated “well capitalized” with top supervisory ratings (CAMELS 1 or 2)—to 31 basis points for the small number of “less than adequately capitalized banks” with “substantial supervisory concern” (CAMELS 4 or 5) (see Table 1 in Garnett et al). Subsequent research shows that banks in the riskier group were more than 35 times as likely to fail over a five-year period (see Table 2 in Garnett et al)!
This initial experiment with risk-sensitive pricing did not last. Once the DIF reached the 1.25% statutory minimum, the Deposit Insurance Funds Act of 1996 compelled the FDIC to set fees on deposits at “well capitalized” banks with top supervisory ratings, which included most banks, to zero. As a result, as the above chart shows, from 1997 to 2006 the average deposit insurance fee plunged to 0.014 basis points! The moral hazard arising from this decade of zero fees was almost surely an important factor in weakening the banking system in the run-up to the 2007-09 crisis (see, for example, Shoukry, 2020, for compelling evidence that higher deposit insurance fees substantially diminish risk-taking by insured banks, provided that supervisors limit regulatory arbitrage).
As a result of Congressional mandates, from the late 1980s to around 2010, deposit insurance fees were wildly pro-cyclical (see chart above). When the DIF balance plunged, statutory requirements forced the FDIC to raise assessment rates. As a result, surviving banks paid for the losses that arose from those that failed. In addition, average insurance fees both before 1990 and in the decade to 2007 clearly were insufficient to guarantee DIF solvency in periods of crisis.
Deposit Insurance After Dodd-Frank. So, where do things stand today? In 2011, following the Dodd-Frank Act, the FDIC implemented its current risk-based pricing framework.
At an aggregate level, Dodd-Frank raised the minimum DIF ratio to 1.35%. Importantly, the FDIC can also set both a higher DIF ratio and impose risk-sensitive fees. To prevent a return to a negative DIF balance, the FDIC set a “long-term” goal for the DIF ratio equal to 2 percent of insured deposits—something they believe they can achieve with a steady average premium of just over 8 basis points (see Ellis).
At the same time, to limit banks’ ability to avoid insurance charges by substituting other short-term liabilities for deposits, Dodd Frank required the FDIC to expand the assessment base from domestic deposits to a broader measure of liabilities (assets minus tangible equities). Nevertheless, as the gray-shaded area in the chart above shows, in 2020 the DIF remains well below the 2% goal and the average premium is roughly half of what likely would be needed to achieve and sustain that goal.
To set fees commensurate with a bank’s risk, bank-level insurance pricing now differentiates between small banks (less than $10 billion in assets), large banks (more than $10 billion in assets), and complex banks (with more than $50 billion in assets and a parent having more than $500 billion in assets). Furthermore, the current framework uses a scorecard of indicators to estimate the likelihood and scale of DIF losses as a basis for setting the insurance premium. For large banks, the scorecard employs both confidential supervisory ratings (CAMELS) and measures of balance sheet risk such as an institution’s Tier 1 leverage ratio and an estimate of asset credit quality (see Garnett et al Table A.1). For complex banks, the scorecard adds measures of market risk, counterparty credit risk concentration, and the bank’s reliance on short-term funding (see Garnett et al Table A.2).
A glance at the current approach makes it immediately clear that, since the crisis of 2007-09, the FDIC has sharply raised the standard for setting risk-sensitive insurance premia, helping to limit moral hazard and protect taxpayers. Nevertheless, like most financial regulatory and supervisory practices, there is almost certainly room for improvement. Having operated under the present scorecard system for large and complex banks since 2011, an update of the component indicators and their weights could help improve the framework’s accuracy in assessing risks to the deposit insurance fund.
For example, an update might be especially useful for gauging potentially disastrous spillover effects of the failure of one or more highly complex banks on others that could lead to a chain of DIF-depressing failures. The largest, most interconnected banks already routinely report dozens of relevant indicators—such as the leverage exposure ratio which accounts directly for off-balance sheet risk—that are used to calculate their Basel systemic risk scores (see the OFR’s Bank Systemic Risk Monitor). If any of these measures prove useful in improving DIF loss projections, why not revise the scorecard, say, every few years?
Yet another possible refinement would be to utilize market indicators of potential loss to the deposit insurer (see, for example, Camara, Davidson and Fodor). While such high-frequency information may be ill-suited for directly setting deposit insurance fees, market measures could nonetheless serve as a check both on the relative pricing of deposit insurance across banks and on whether average fees are adequate to ensure DIF sustainability. In addition, supervisors could use large deviations of market indicators from scorecard measures to decide where to focus attention.
In the end, a deposit insurance framework that aims to avoid pro-cyclicality and to set actuarially fair prices across insured firms cannot stand still. As technology, competition, and the structure of both domestic and international markets evolve, so do the opportunities and means for financial risk taking. Economic conditions matter greatly as well. Had COVID not triggered such a massive monetary and fiscal response, the potential wave of bankruptcies could have led to record levels of nonperforming loans and bank failures, followed by a new procyclical wave of higher deposit insurance premia.
Having avoided such a COVID disaster (at least for now), the FDIC might consider taking the opportunity to raise the average insurance premium over coming years sufficiently to make its long-term objective of a 2% DIF ratio more realistic.
Acknowledgements: Without implicating her, we are grateful to Diane Ellis, Director of the FDIC Division of Insurance and Research, for providing us with the data for the second chart and for educating us about the FDIC’s scorecard approach to measuring the risk of large and complex institutions.