
Inflation: Don't Worry, Be Prepared
“The path of inflation is also difficult to predict, although there are a variety of reasons to expect an increase in inflation associated with reopening that is largely transitory.” Federal Reserve Board Governor Lael Brainard, May 11, 2021.
“[W]e’re all very familiar at the Fed with the history of the 1960s and ’70s, of course. And we know that our job is to achieve 2 percent inflation over time. We’re committed to that, and we will use our tools to do that.” Federal Reserve Board Chair Jerome H. Powell, Press Conference, April 28, 2021.
Everyone seems to be worried about inflation (see here and here). People also are concerned that the rising media salience of inflation could raise inflation expectations, leading to a sustained rise in inflation itself.
April price readings certainly boosted these worries: the conventional measure of core inflation—the CPI excluding food and energy—rose by nearly 3% from a year ago, the biggest gain since 1995. Fed Vice Chair Richard Clarida summed up the nearly universal reaction when he said: “I was surprised. This number was well above what I and outside forecasters expected.”
The experience of the high-inflation 1970s makes people prone to worrying about such things. Our reaction is different. After all, worry alone is not going to prevent a sustained pickup of inflation. Only credible anti-inflationary monetary policy can do that. To ensure that inflation expectations remain low, it is up to the central bank to make sure everyone understands how policy will respond if the latest elevated inflation readings prove to be more than temporary. As we have written before, the key is effective communications, not premature action.
Indeed, while the latest price shocks may be transitory, we are far from confident that they will remain so. Aside from what occurred in the aftermath of wars, the current economic environment is virtually unprecedented. In addition to various supply obstacles, we are living through a period with massive monetary and fiscal stimulus that is contributing to rapid aggregate demand growth. As a result, it is anyone’s guess how prices will behave over the next few months.
To be sure, the nature of the recovery also raises questions about the reliability of price measures themselves. Recall that in the initial phase of the pandemic, consumer prices were falling. While there were toilet paper shortages and booming liquor stores, a large fraction of the service sector was shut down entirely. This meant that some prices were falling while others simply didn’t exist. At the time, we warned that these extraordinary events made conventional price statistics potentially misleading. While the economy is now growing rapidly, the persistence of supply obstacles means that price readings remain unreliable indicators.
Against this highly uncertain background, statistical measures of trend inflation probably are the most useful ones, and these suggest that inflation is only slightly above 2%. The following chart of annual price changes makes the point. First, note that the headline CPI (solid black) is extremely volatile, with the April reading above 4%. If we exclude food and energy, the annual increase is nearly 3% (dotted black). However, our focus is on the trimmed mean CPI, which rose by 2.4% and was relatively stable over the past year (red). Keeping in mind that annual CPI inflation averages about 0.3% higher than that of the Fed’s preferred PCE price index, the inflation trend remains largely in line with the central bank’s 2% longer-term goal.
Consumer Price Indexes (Percent change from year ago), 1995-April 2021

Source: FRED.
On top of this, it remains the case that over the past 25 years—when the Fed has behaved as a de facto inflation-targeting central bank—inflation has been far more stable than in the previous 30 years. To see this, consider the following chart, which depicts the histogram of 12-month inflation changes for two samples, from 1960 to 1994 (dashed line) and from 1995 to 2021 (solid lines). We show the CPI excluding food and energy, which is available for both periods, as well as the preferred trimmed mean CPI, which is not available prior to 1983. The comparison is striking. Prior to 1995, inflation was above 3% more than three-quarters of the time and above 5% in two of every five years. For the past 25 years, core CPI inflation has been between 1% and 3% (the shaded area in the graph) more than 95% of the time!
Frequency Distributions for 12-month changes in core consumer prices, 1960-94 and 1995-April 2021
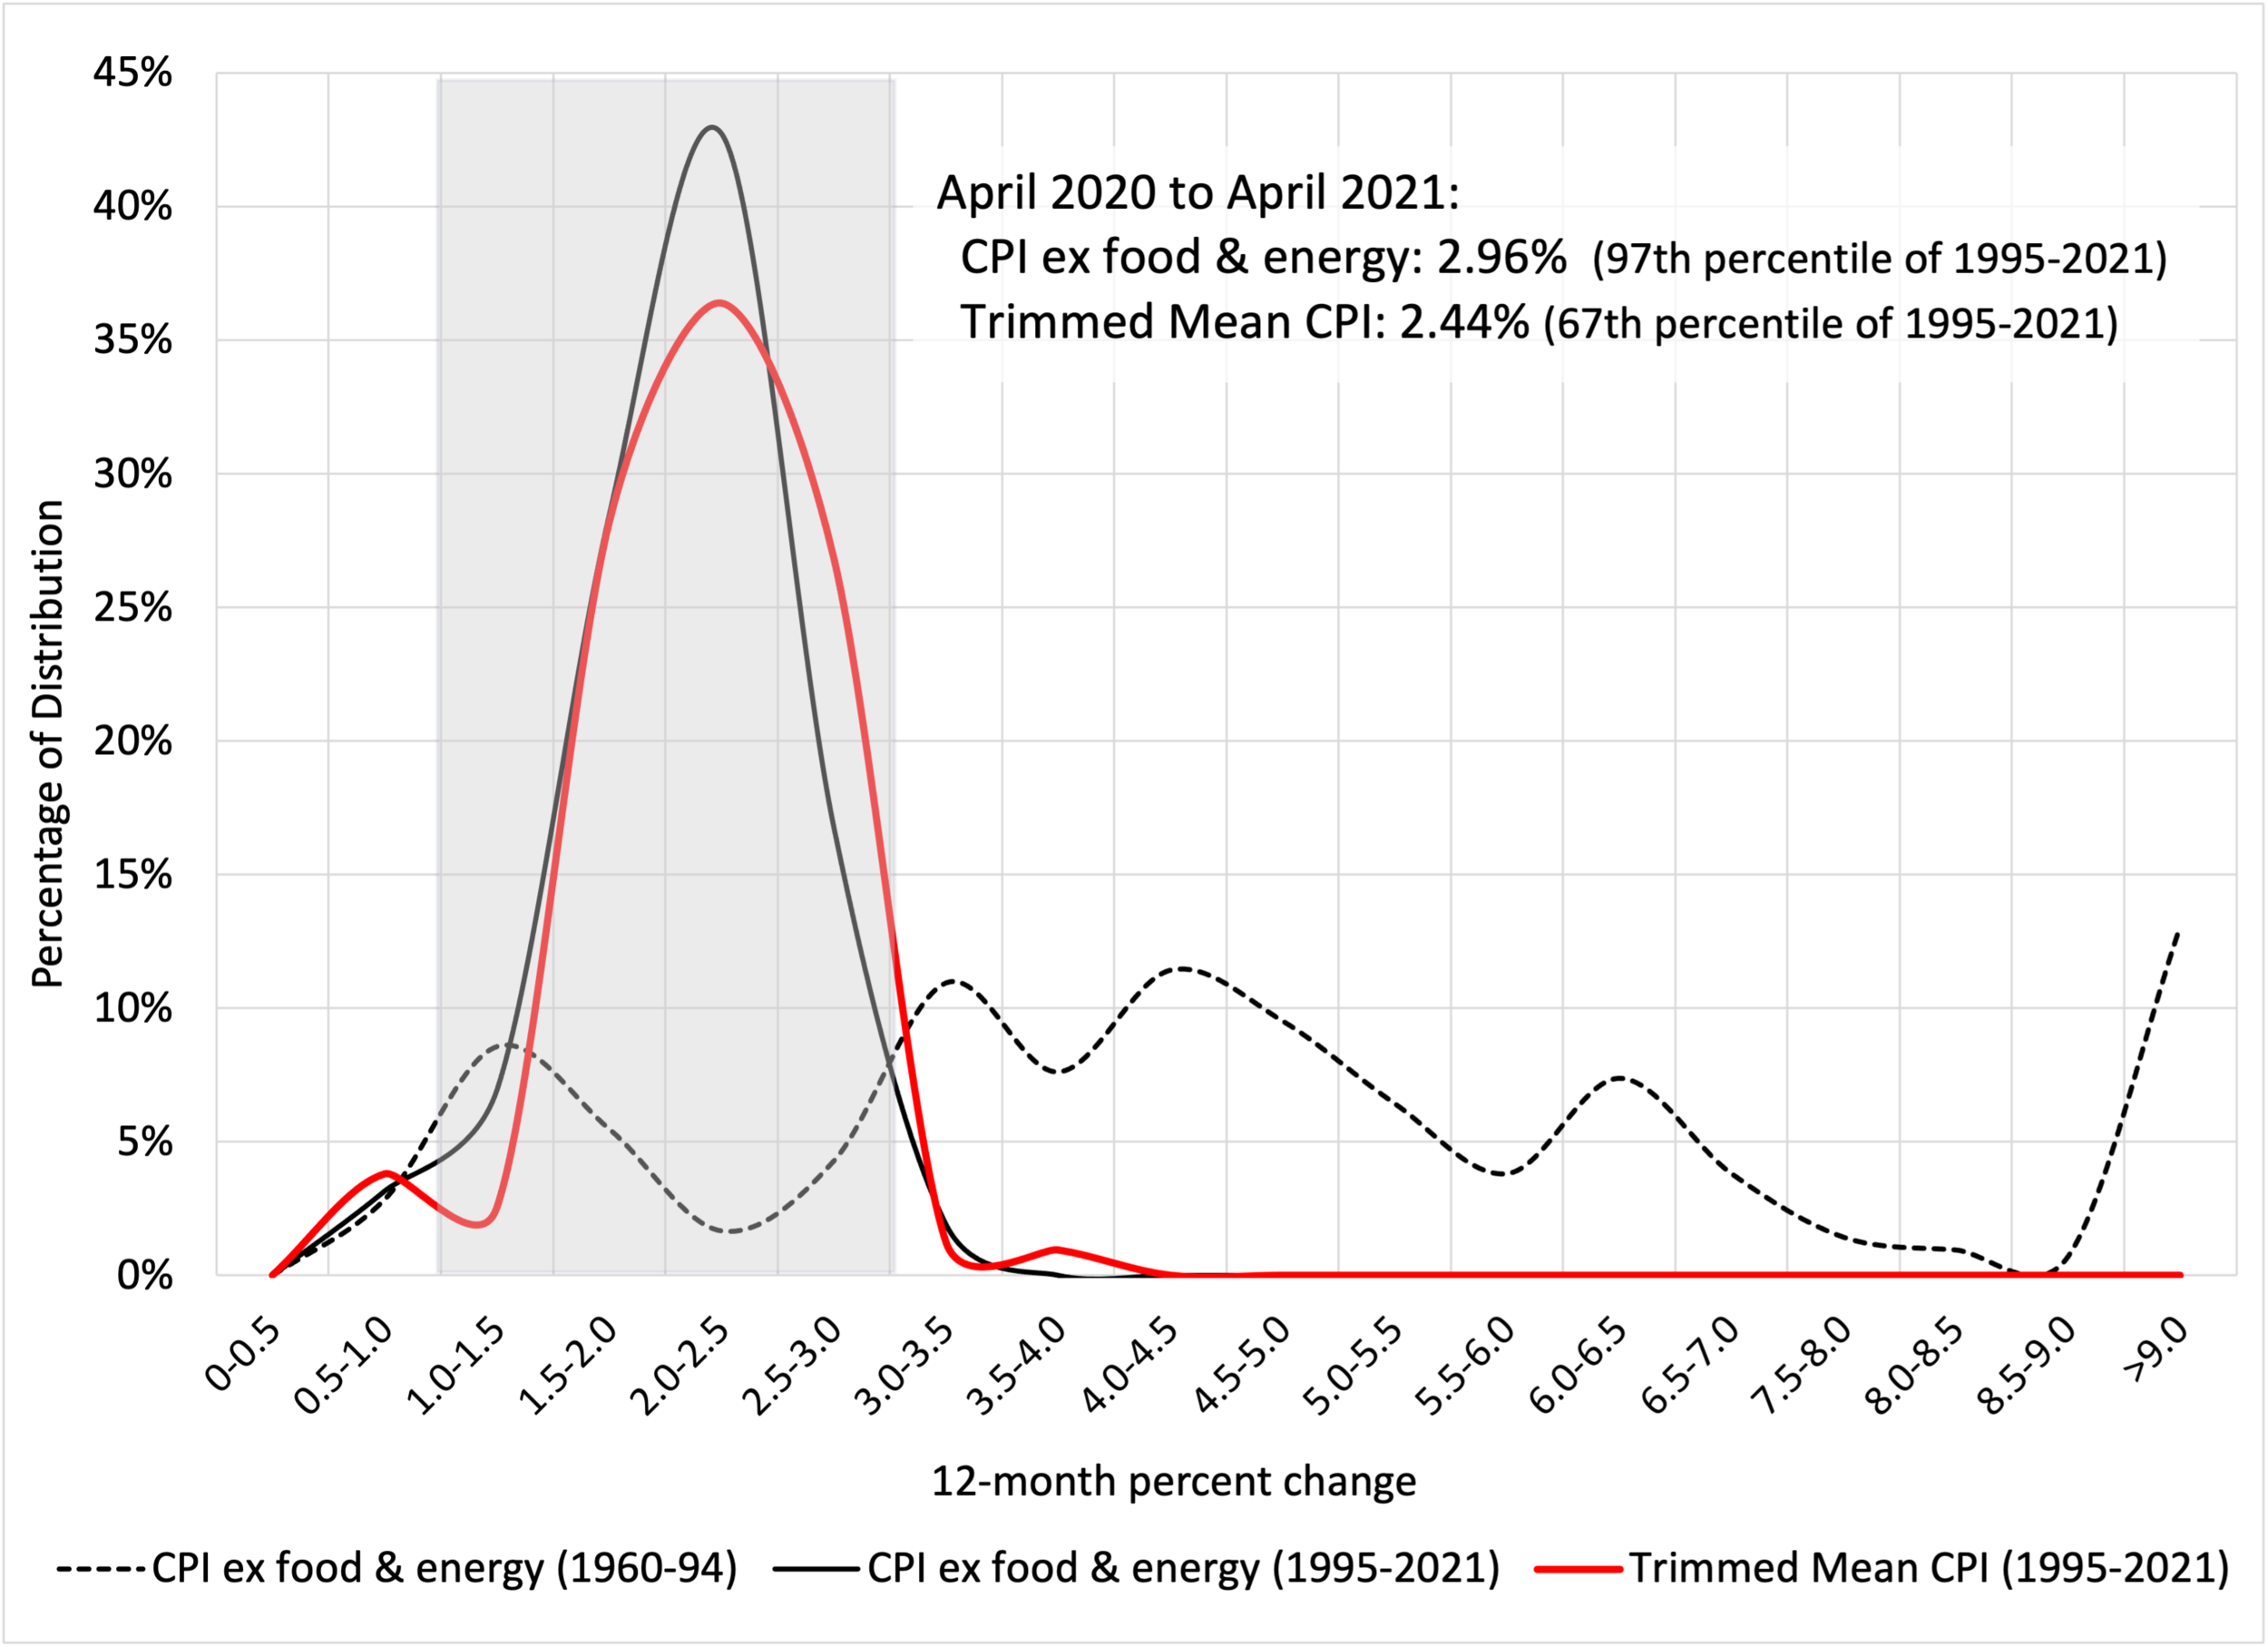
Source: FRED and authors’ calculations.
Yet, the stability of inflation since the mid-1990s is good news for everyone except for those who wish to assess and anticipate what causes inflation to move around. Modeling is a statistical exercise in which you look for correlations—albeit subtle ones that provide information about causality. When the relevant quantities vary considerably, you have some chance of finding relationships. While modeling inflation in the 1970s was a complicated and difficult task, at least there was variation in the data. More recently, however, policymakers’ success in keeping inflation stable makes the exercise nearly impossible. The entire inflation forecasting apparatus, both in the private and public sector, has been focused on assessing the likelihood of small changes away from the 2% objective. It tells us little about what might lead to sudden and persistent rises or falls of greater scale.
Moreover, the current economic and policy environment is nothing like what we observed during the period of stable prices that began in the mid-1990s. The monetary stimulus that began in March 2020 arguably exceeds anything we have seen in the history of Federal Reserve. Fed assets are approaching $8 trillion, and policymakers are continuing to purchase $120 billion worth of Treasury and agency bonds per month. With a rising portion of the population fully vaccinated, households look set to start spending some of the more than $2 trillion in additional savings accumulated during the shutdown.
Then there is the extraordinary scale of fiscal action. In the following chart, we plot a crude estimate of the discretionary portion of the U.S. fiscal balance (as a percent of GDP) on an inverted scale. That is, we first estimate the portion of the federal government deficit that is due to automatic stabilizers and then remove it. When this “cyclically adjusted” fiscal balance turns more negative, the fiscal thrust increases. Notably, the 2020 observation is more than three times that during both the financial crisis in 2009 and the Vietnam War in 1968. While we are not able to go back prior to 1960, our suspicion is that the 2020 number is the largest since World War II.
Discretionary fiscal stimulus (Percent of GDP, annual), 1960-2020
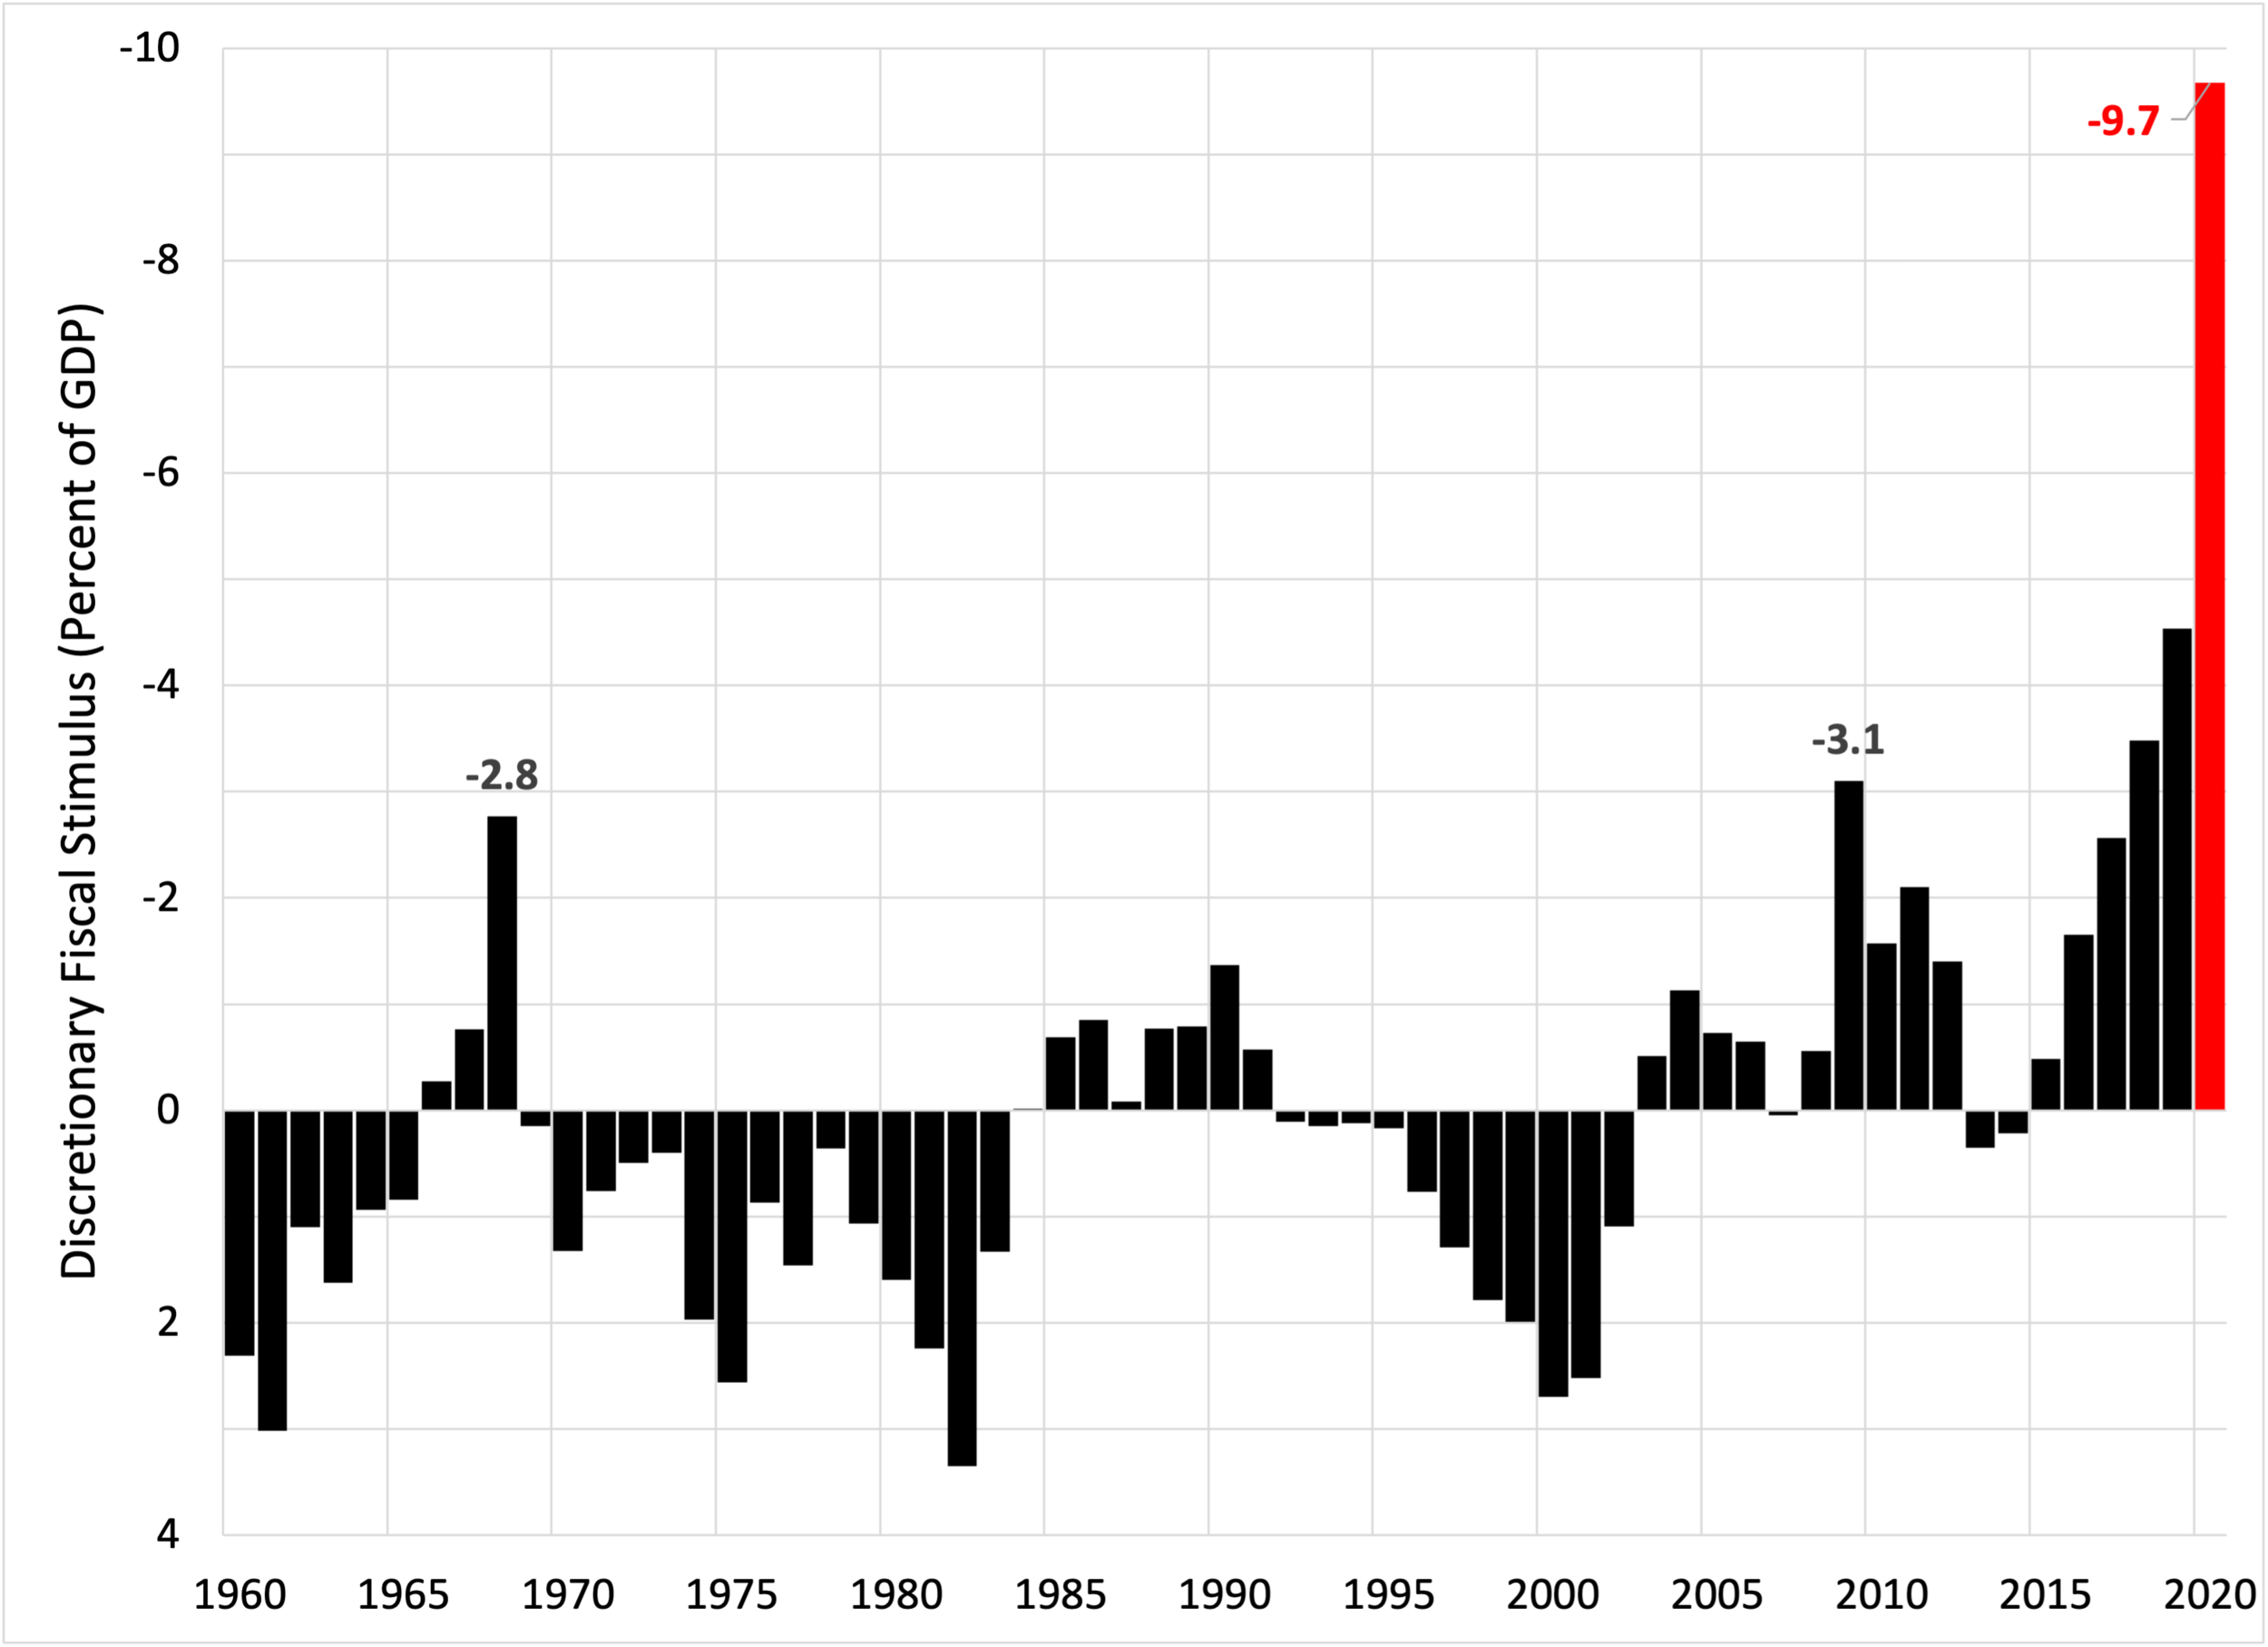
Note: We plot the residuals from a regression of the fiscal-year U.S. federal deficit (as a percent of GDP) on the calendar-year unemployment rate. Source: FRED and authors’ calculations.
All of this leads us to conclude that, while there is little evidence that the trend of inflation already has risen, there is a clear risk that it will. Not surprisingly, a market measure of the probability that inflation will be below 1% over the next 5 years is now virtually zero, while the odds that it will be above 3 % exceed 40% (see the Federal Reserve Bank of Minneapolis market-based probabilities website).
So, we surely hope that Governor Brainard is correct when she argues that the recent inflation burst will prove to be transitory (see opening quote). But we are nevertheless led to three important questions that we hope policymakers will address in the coming weeks and months:
What will it take to convince them that the pickup of inflation is not transitory?
What would they do if this happens?
What should they do in the meantime?
Our tentative answers are as follows. On the first, we will be convinced that the inflation increase is persistent if we see a sustained increase that cannot be explained away (like the April reading) by measurement problems. In practice, this means at least three months of average increases of more than 3% in measures like the trimmed mean CPI (or of close to 3% for the trimmed mean PCE).
As for what policymakers should do in the meantime and what they should do when this happens, here we recall our fundamental view about monetary policy: be clear about how you will react to changes in the economic and financial environment so that private decisionmakers (including participants in financial markets) respond to data rather than to policy announcements (see our recent post). This means more than simply committing to use tools to avoid another episode like the 1970s, as Chair Powell reiterated last month (see the opening quote). The Fed also should be clear about the conditions that will lead to a change in its asset purchase program, as well as what will trigger an increase in policy rates.
Finally, we encourage policymakers to remain humble about their ability to forecast inflation. Since COVID began, we have known very little about what is coming next. Amid such uncertainty, we understand policymakers’ instinct to move cautiously, much as one would when driving without headlights on a foggy night on the edge of a cliff.
But, that kind of uncertainty is not well suited to strong commitments to keep expanding asset purchases or to keep interest rates low for years to come. While traveling along the cliff’s edge, the driver needs to be prepared to brake or to swerve, and must signal oncoming traffic regarding possible changes in trajectory.
For the Fed, the question is how to ensure inflation expectations of households and businesses (let alone financial market participants) remain near their 2% longer-term goal now that policymakers have explicitly given up their commitment to acting preemptively (see our earlier post). Unless inflation readings begin to recede within a few months, a key test of the Fed’s anti-inflation credibility (and of its communications framework) will not be far away.