
Productivity and Employment: AI's Promise and Pitfalls
“You can see the computer age everywhere but in the productivity statistics.” Robert M. Solow, “We’d Better Watch Out,” New York Times Book Review, page 36, July 12, 1987.
“…[W]e were standing in the foothills of the singularity.” Demis Hassabis, A Framework for Frontier AI and the Dawning of a New Age, July 14, 2026
Congress mandates the Federal Reserve to achieve maximum sustainable employment and price stability. Artificial intelligence (AI) affects both. The role of Chair Warsh’s Productivity and Jobs Task Force is to help the Federal Open Market Committee (FOMC) understand those effects. Its charge is to “assess the economic impact of new general-purpose technologies, including artificial intelligence, to inform the Federal Reserve's policy judgments.”
So how should the Task Force address this challenge? More to the point, what does the FOMC need to know about AI?
The Task Force should start by conceding that nobody can speak with authority about the size or scope of AI's eventual impact on the economy. The Committee's problem — and by extension the Task Force's — is more manageable:
Enumerate a range of plausible paths for the economy.
Identify the indicators that reveal which path we are on.
Establish how much the FOMC can trust its usual policy guides as AI advances.
Take the first. It helps to know what range serious people consider plausible. Since mid-2025 the Forecasting Research Institute has run a monthly survey of several hundred experts, alongside professional forecasters and a sample of the public. Asked to rank AI's eventual significance against past technologies, the panel most often chose the tier occupied by electricity and the automobile: a technology of the century. They put roughly one chance in three on its reaching the tier of the printing press. While these are all large claims, they remain sober ones, and far from Hassabis’ catastrophic singularity (see the opening citation).
Yet, how far AI will get probably is not the key driver of economic developments over the next few years. In a separate exercise conditioning on explicit AI capability scenarios, Karger et al. trace only a tiny fraction of the variance in forecasts of 2030 GDP growth to disagreement about AI capabilities. In contrast, the share linked to disagreement about what those capabilities would do to the economy is about 50 times larger (at roughly 16 percent). Settling the question everyone debates about the future of AI would barely help with the one the FOMC must answer.
In what follows, we take a very rough first pass at what the Task Force should do — and, more importantly, of what it should be telling the FOMC to do routinely. We start with three paths the economy might take, built on the three Karger et al. scenarios for AI progress by 2030. We ask what evidence would distinguish these paths, how soon that evidence could arrive, and how much the FOMC can rely on the usual unobservable policy benchmarks in the meantime. Using a combination of stylized models and historical data, policymakers must estimate what economists call the “stars”: potential output (y*) and the natural rates of interest (r*) and unemployment (u*).
The evidence that would tell us which scenario we are in is years away. But even now we can say this: the greater AI’s ultimate impact, the less reliable the usual benchmarks are likely to be in the transition. That makes the Committee's current challenge one of risk management: setting policy in ways that do not rely heavily on knowing which AI scenario occurs, while preparing to adjust policy sharply once that becomes clear.
Three ways this could go
The first step in managing uncertainty is to make it concrete. The range of AI capability outcomes is so wide that scenarios are the only practical tool. No single forecast can stand in for a probability distribution running from a useful office assistant to a machine that outperforms all people at most of what they do.
The Karger et al. economists' survey includes three scenarios through 2030. They differ by the job an AI can complete on its own. Under slow progress, AI is an assistant. Under moderate progress, AI becomes a collaborator. It can drive a car as well as a person. Under rapid progress, AI compresses research that would have taken years into days, outperforms administrative staff, and can work in any home or factory.
It is important to distinguish these AI capability scenarios from what the survey respondents provided, namely what each scenario does to output, employment and prices – exactly what the FOMC needs to know. The survey set a demanding bar: a capability counted as reached only when a machine could do the work as cheaply and dependably as a person can now. That is worth remembering when considering the 14 percent probability that economists assigned to the rapid progress scenario. Table 1 reports their median responses.
Table 1. Three scenarios for AI capabilities by 2030, and what economists expect from each (medians except where specified)
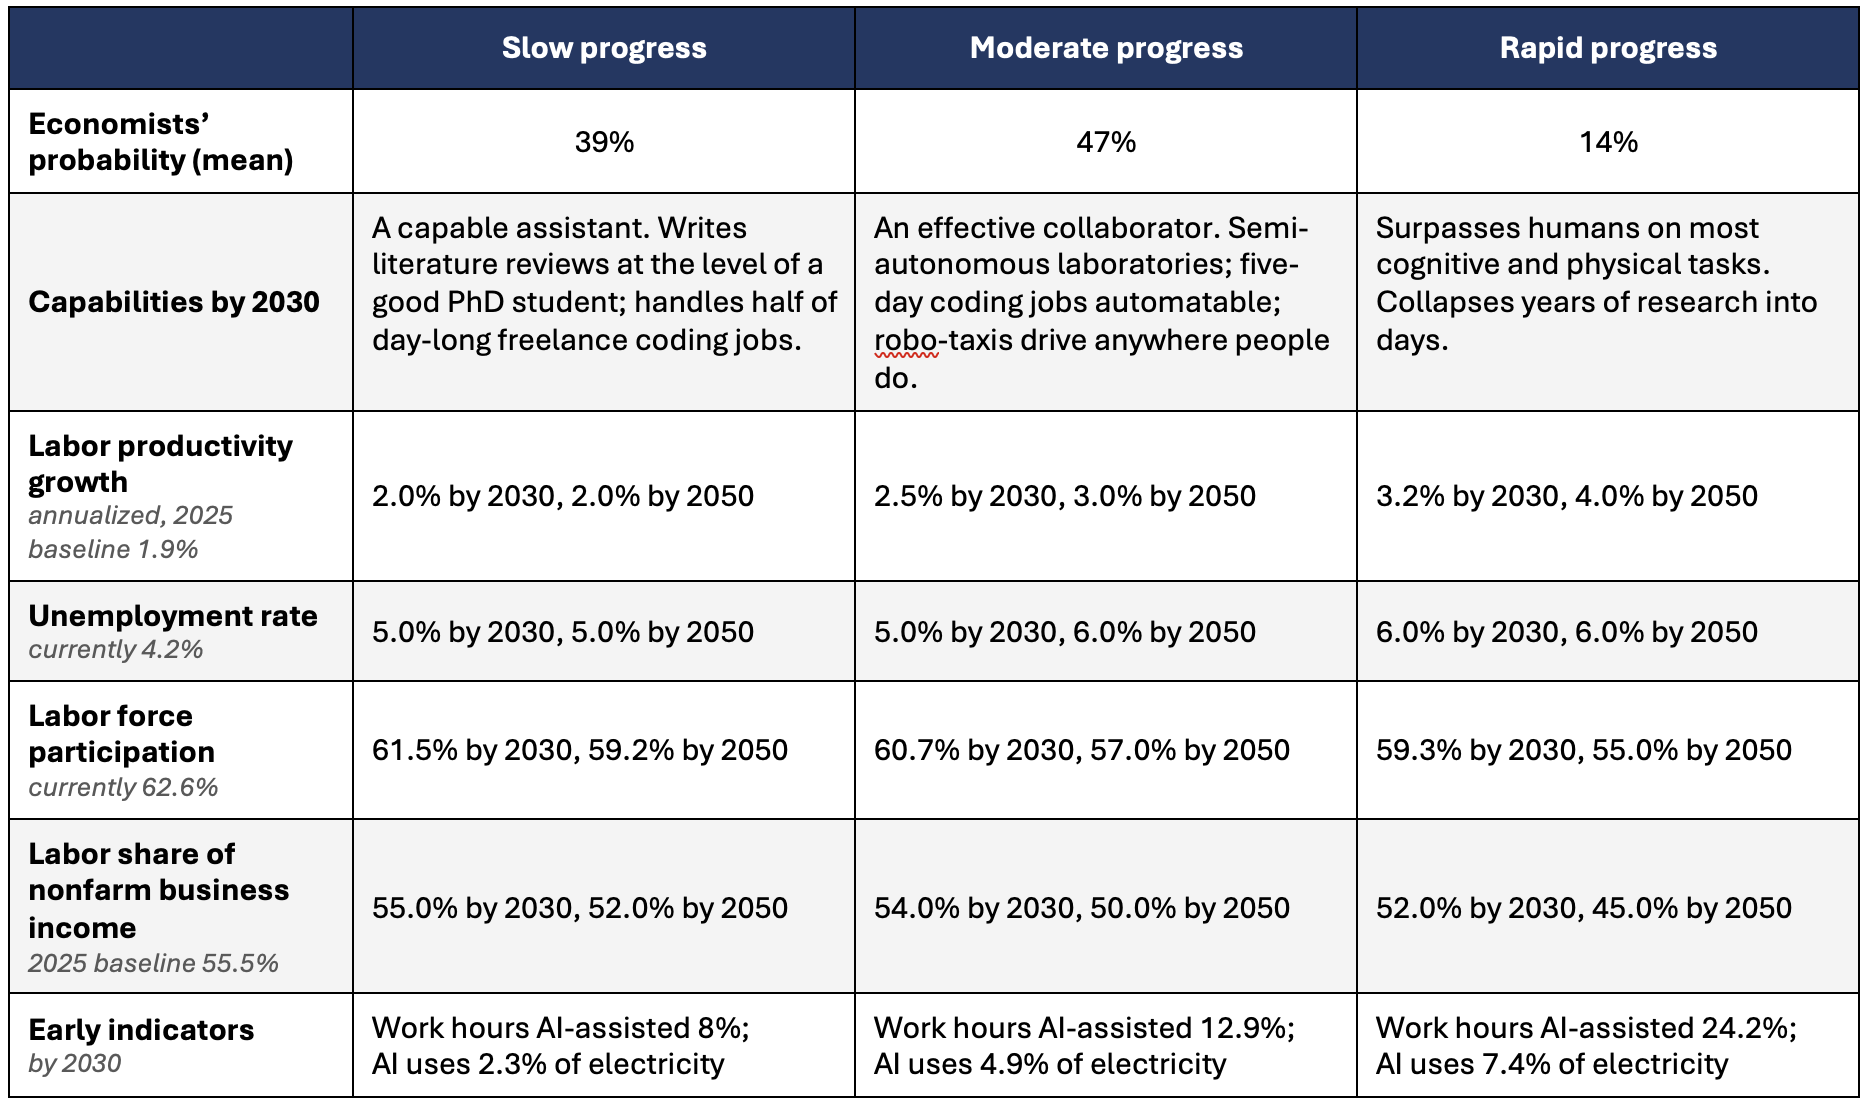
Notes. Forecasts are median responses from economists in the Karger et al. survey, conducted between October 2025 and February 2026; probabilities are group means. Full results are in the paper’s online appendix.
Economists’ expectations for the labor market are illuminating. They see little sensitivity of the unemployment rate to widely different AI scenarios, and little five-year variation in employment or participation. The latter response comes mostly over decades. If unemployment and participation respond that slowly, conventional labor market indicators will not tell the Committee which AI world it is in until long after it has to decide. (Labor's share of income does move: by 2030 it falls several points further under rapid progress than under slow.)
To be sure, the central bank has virtually no control over long-run labor market outcomes. But it must assess the state of the economy continuously, and the usual labor metrics likely provide no transition signal. Is real output above or below potential? Is the policy interest rate above or below neutral? To answer these questions, the FOMC will need to look at other indicators.
So what would help the FOMC identify the prevailing scenario? The bottom row of the table suggests one answer. By 2030, the share of work hours assisted by AI varies sharply across the scenarios. Similarly, AI's share of electricity consumption is highly sensitive. Both measures are already available.
Labor market flows also can help distinguish the scenarios, even if the unemployment rate does not. To distinguish changes in labor demand and supply (and in matching efficiency), Barnichon and Figura built their decomposition of the Beveridge curve out of gross worker flows. In their framework, observers can separate cyclical slack from a change in the sustainable unemployment rate. This type of robust analysis — built from observables rather than filtered from a trend — exemplifies what the FOMC needs to develop for finding its way in a changing AI world.
So far, studies of exposed occupations cannot agree whether there is an effect at all. Brynjolfsson, Chandar and Chen report a 13 percent relative decline in employment for workers aged 22 to 25 in the most exposed occupations, while Gimbel and co-authors find the occupational mix broadly stable. Potentially more useful is a finding of Simon et al.: most of AI’s impact to date involves “within-job” changes of activity rather than movement between occupations. If so, the flows may see it when occupational data do not.
What about the current signals from output and investment?
Start with a distinction the Committee cannot avoid. As we discussed in our previous post, policy leans against an increase in aggregate demand that pushes output and prices in the same direction. Policy accommodates an increase in aggregate supply – a rise in what the economy is capable of producing – that pushes output and prices in opposite directions. Mistake the second for the first, and you tighten when you should ease.
So far, AI is showing up as a demand expansion. Firms are building data centers and buying chips – adding capacity that is not yet producing anything (or for which the service is cross-subsidized – like a free web search tool that does not affect GDP). The upper panel of Figure 1 is the demand-side impulse: the contribution to growth from AI-relevant investment. It jumped after 2024, reaching about one percentage point by early 2026 — just short of the 1999 peak. The lower panel represents the supply side: labor productivity growth. Output per hour picked up after 2023, but the acceleration preceded the investment boom. Capital deepening from AI came too late to have caused it.
Figure 1: Contributions to real GDP growth from AI-related investment (top panel) and output per hour (bottom panel): Quarterly, Percent changes from four quarters ago, 1995 — 2026.
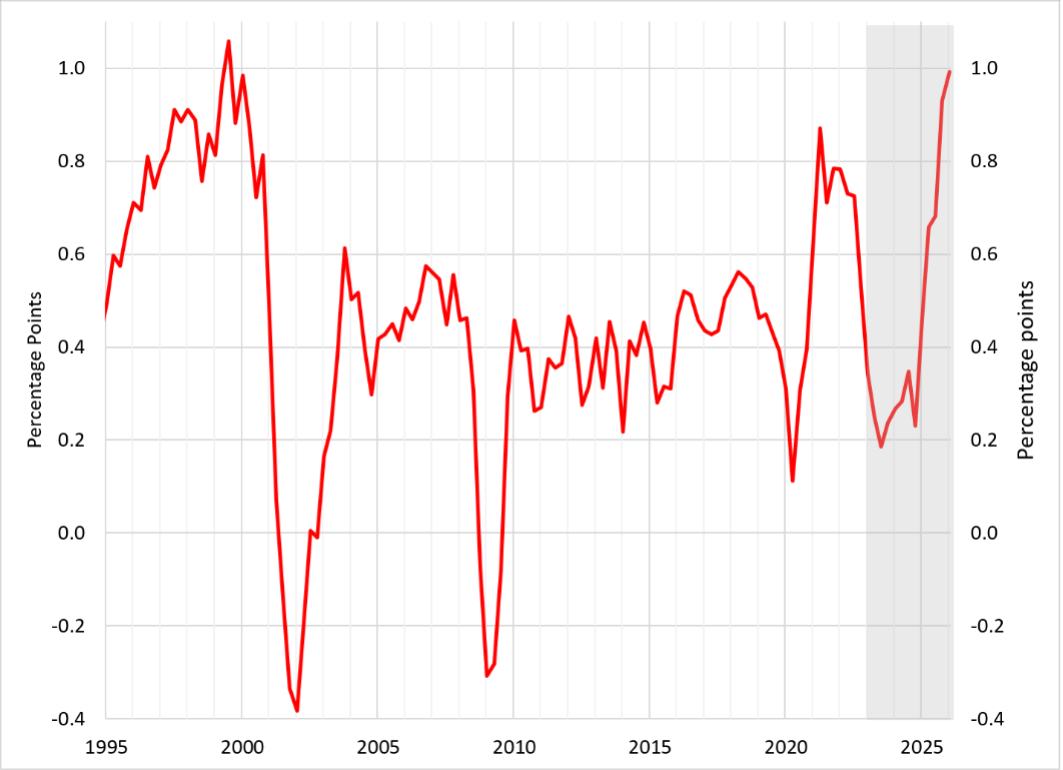
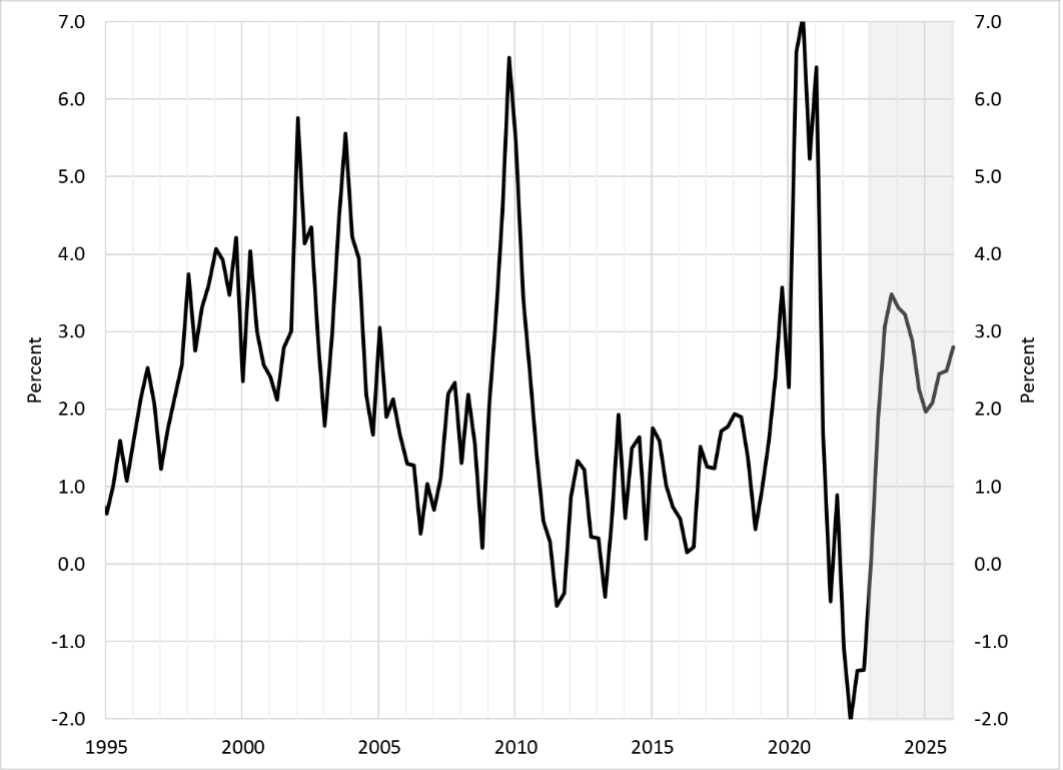
Notes. AI-related investment includes information processing equipment, software, and research and development. Sources. FRED series OPHNFB (Bureau of Labor Statistics, Major Sector Productivity and Costs) and Bureau of Economic Analysis, Table 1.5.2, lines 31, 38 and 39.
The point of all this is that the Task Force (and the FOMC) must start its analysis from a position of great uncertainty about the progress of AI capability and its economic impact. As Solow knew (see opening citation), lagging productivity growth is not evidence for the slow AI scenario. A genuine increase in supply may well appear at first as an increase in demand. Moreover, Brynjolfsson, Rock and Syverson’s productivity J-curve highlights why measured productivity may be understated in the early years of a general-purpose technology.
Are the Committee’s benchmarks fit for purpose?
That brings us to a key question: how will AI progress and its economic impact affect the quality of the Fed’s most common policy guides?
Each column in Table 1 implies a claim about three quantities that the FOMC cannot observe: potential output (y*) and the natural rates of real interest (r*) and unemployment (u*). Virtually every Committee policy guide measures gaps against estimates of these unobservables. So how good are those estimates?
We can answer that for the output gap. Figure 2 compares what the output gap looked like when first estimated against what it looks like now. Across 111 quarters, the average absolute revision is 1.2 percentage points. In 21 quarters, the real-time estimate put output below potential when we now believe it was above, or the reverse.
Figure 2: Revisions in measures of the output gap (Quarterly, Percent of potential output), 1993Q1 — 2026Q1
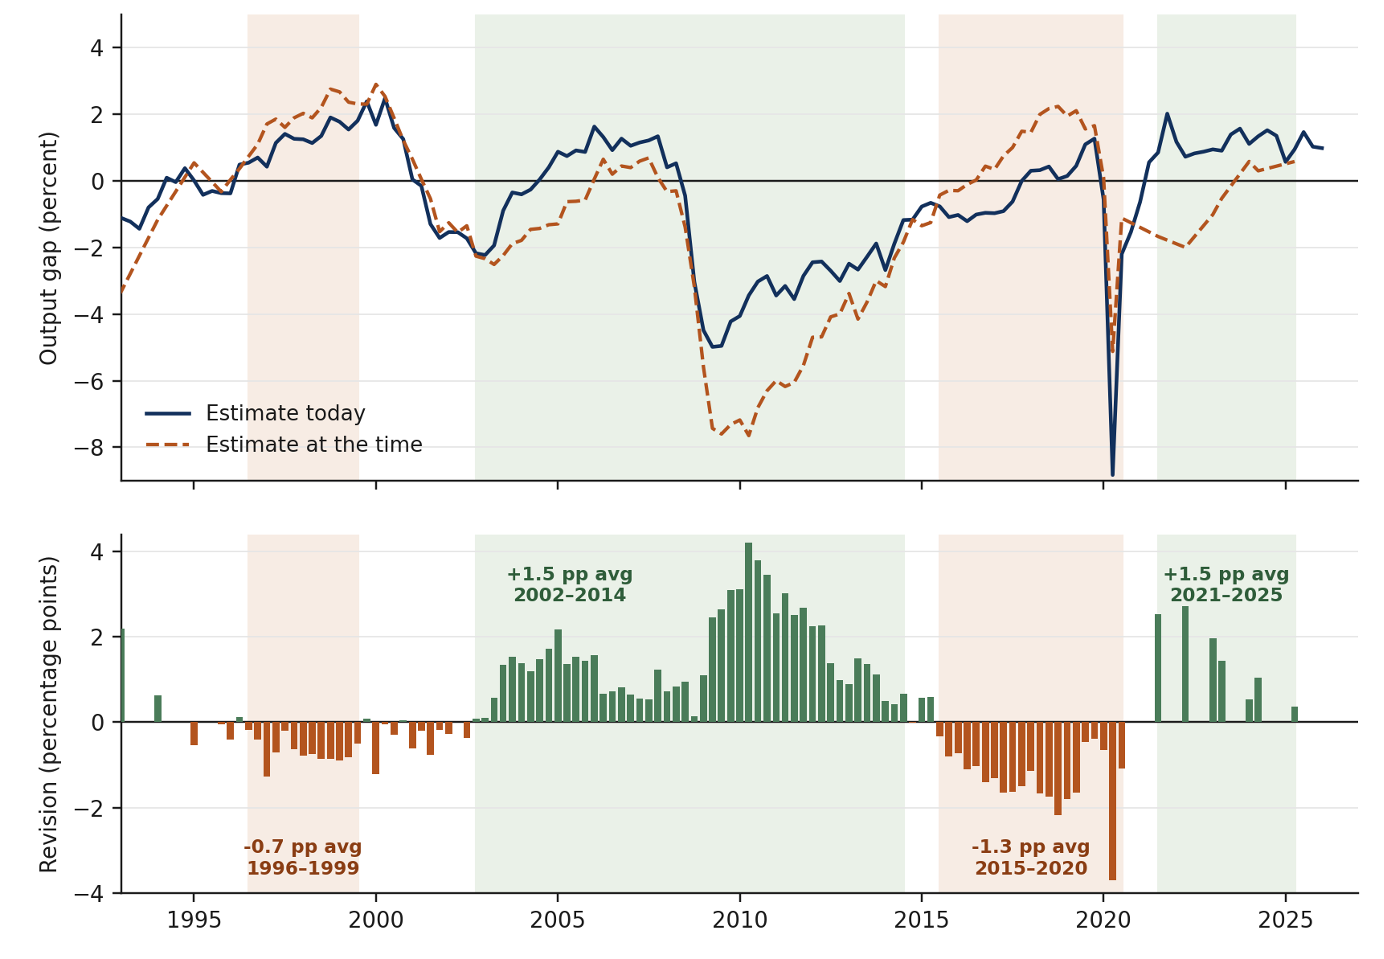
Notes. Top panel: the real-time output gap and today’s estimate for the same quarter. Bottom panel: the revision, today’s estimate less the real-time estimate. Real-time estimates are Federal Reserve Board staff Greenbook output gaps where available — 1996 to 2020, taking the first estimate of each quarter — and gaps computed from paired vintages of CBO potential output and BEA real GDP elsewhere. Today's estimate uses the current vintage of both. Shading denotes episodes of three years or more in which the revision keeps one sign.
Sources. Federal Reserve Bank of Philadelphia, Greenbook data sets; ALFRED, series GDPPOT and GDPC1.
The bigger problem is serially correlated errors: as the bottom panel highlights, the revisions keep one sign for years at a time. From 2002 to 2014 — 12 consecutive years — every real-time reading was too pessimistic, by 1.5 points on average. Then the sign flipped for five years. Then it flipped again: from 2021 through the inflation surge, the gap read as slack when we now believe output was above potential.
Serially correlated errors mean the Committee was not making occasional mistakes but was maintaining a mistaken view for years. We are far from the first to notice this. In 1999, Orphanides argued that misperceptions of the economy's productive capacity were the primary underlying cause of the Great Inflation. Policymakers in the 1970s believed there was slack that was not there, and they eased into it. Orphanides measured that error, traced it to an unrecognized slowdown in the trend growth of potential output (y*), and proposed rules that respond to inflation or to the change in activity rather than to the level of the output gap (y-y*).
Figure 2 shows that this problem survived its diagnosis. Every episode since the 1970s carries the same signature. A key reason is that model-based standard errors assume the model is right. They say nothing about the structure itself changing — which is what rapid AI progress would mean. And filtered estimates of unobservable trends – like the ones the FOMC employs – are least reliable at the end of the sample, precisely where policymakers need them the most.
This bears directly on efforts to distinguish the economic impact of the AI capability scenarios. Look again at what separates the columns of Table 1: annual productivity growth of 2, 3 and 4 percent by 2050. Those are not differences in levels, they are growth rates. A one-time gain in capacity is something the usual statistical filters eventually catch up to. A change in the trend is what they chase for years. This is what the 12-year run in Figure 2 looks like, and what Orphanides found in the 1970s.
That leaves the Committee facing two risks, and they point in opposite directions. If AI raises trend productivity growth, estimates of y* will be too low, encouraging the FOMC to tighten into an expansion of supply. Conversely, if AI disappoints after a capital-spending boom that has already raised measured productivity, estimates will be too high and policy will stay loose too long. That second error is the one Orphanides documented, driven by a fall in trend growth that nobody saw at the time. Neither risk is remote, and the Committee cannot tell which it is running by relying on existing benchmarks.
One caution about reading the survey results in Table 1. These are medians, and the median of the rapid progress column conceals the widest distribution in the survey. Conditioning on rapid progress raises the spread of forecast GDP growth by about a third, with some respondents putting 2050 annual growth above 10 percent! In the theoretical models Trammell and Korinek discuss, AI that automates research as well as production can generate explosive (“hyperbolic”) growth rates far above historical experience. Whether or not that happens, the further out the tail we land, the worse the Fed’s policy problem gets: a larger break in trend means the unobservable benchmarks lag longer and by more, and the case for risk management strengthens. Even if the rapid scenario arrives by 2030, we still will not know how rapid going forward.
Managing the risk
If the Committee cannot tell which risk it is running, what should it do? The classic answer is nearly 60 years old. Brainard showed that a policymaker unsure about the potency of its instrument should move in smaller steps than certainty would justify. The usual objection — that with limited room to cut, a central bank should move fast to maximize its impact — is an argument about the effective lower bound, and it does not apply today. Interest rates are far above zero. Brainard's result concerns uncertainty about the instrument. The same logic applies to uncertainty about economic conditions. In the latter case, responding fully means responding to noise.
Nevertheless, Brainard-like policy attenuation is not the whole answer. Orphanides and Williams show that the cost of underestimating how badly the benchmarks are mismeasured substantially exceeds the cost of overestimating it, and that rules built on the assumption that mismeasurement is small perform particularly badly. Their remedy is to respond to changes in activity rather than levels. A “difference rule” never asks where y* is, so it reduces reliance on the quantity that Figure 2 shows we cannot measure. Orphanides had already made the quantitative case in 1999: real-time errors in the change in the output gap were smaller than errors in the level by an order of magnitude.
The improvement is only partial. The rule removes the level of y*, but leaves the growth rate — so misjudging the trend still throws the rule off. While it is better than a rule in levels, it is not a complete solution. The point is that the FOMC – encouraged by the Task Forces – needs to ask which policy approaches are most likely to limit the costs of getting policy wrong when AI is confounding readings on y*, r* and u*. That risk-management obligation also belongs to the Inflation Frameworks Task Force that we discussed in an earlier post.
One more important thing follows. When the evidence finally does distinguish the scenarios, the Committee should move quickly and decisively. Moving cautiously now is not a different posture — it is what maintains the option of moving decisively later. And if outcomes are as uncertain as Table 1 suggests, then expectations about policy should be uncertain, too. The Committee should say so in advance, rather than surprising markets when the moment comes.
What the Task Force should propose
Track the evidence, not just the beliefs. Somebody is already tracking the beliefs about AI capabilities and their impact. The Longitudinal Expert AI Panel (LEAP) has operated a monthly survey since mid-2025, publishing scenario probabilities, quantile forecasts and the reasoning behind them. It is privately funded and due to end in 2028, which is itself worth the Fed's attention. Even so, the Task Force’s value lies elsewhere. What nobody publishes is a running account of the realized evidence mapped to the LEAP scenarios: unit costs where adoption is highest, hiring by occupational exposure, hiring by AI-intensive firms, shifting within-job activities, or the price-and-quantity pair from the same transaction. The Task Force should propose that the FOMC build and routinely publish that. The central bank should name in advance the evidence most likely to shift probabilities between AI scenarios, and report against it on a schedule.
Regularize the diffusion measure the Fed already produces. The Federal Reserve Bank of St. Louis already produces a widely used indicator on AI diffusion: that study put AI-assisted work hours between 1.3 and 5.4 percent in late 2024, and experts expect roughly 18 percent by 2030. The Task Force should propose to put production of this indicator on a regular schedule, and ask the St. Louis Fed to link it to outcomes. The Census Bureau separately measures adoption every two weeks across 1.2 million businesses. At this stage, however, nobody can link firm adoption to the impact on its prices, headcount and output. That linkage is a project for Census, the BLS and the BEA together, and the Fed is the most powerful customer these statistics have. We made the case for observing prices and quantities together in our previous post.
Commission work on alternatives to the stars. If the estimates of the unobservable benchmarks are unreliable for a decade at a stretch, the sensible response is to lean on them less rather than to estimate them with more conviction. Difference rules are one candidate. Another is to replace a filtered benchmark with one built from observables — the flow-based measure of labor market tightness discussed above, for instance, rather than an estimate of u* extracted from a trend. The Task Force should encourage the FOMC to develop and analyze others. It is time to expand the work that Orphanides and Williams began.
Publish a reliability record for the star estimates the Committee uses. For y*, u* and r*, report alongside each current estimate the distribution of past revisions to real-time estimates: the average error, the spread, and the episodes where the sign was wrong. That record is also what would let the Committee judge which alternative benchmarks are worth exploring or adopting. This transparent approach extends FOMC accountability from its projections to its most-discussed parameters. A benchmark published without its error history invites a confidence nobody has earned.
Importantly, none of these recommendations call on the Task Force to forecast how big AI will be. For setting monetary policy, no one can do that with sufficient credibility today, and the Task Force should say so plainly. What it can do is shorten the time between the world changing and the Committee noticing, and encourage the Committee to act in the meantime in ways that are robust to being wrong. Given how far apart the AI scenarios sit, that is not a modest ambition.
Disclosure: One of the authors (Cecchetti) is a member of the expert panel surveyed by the Longitudinal Expert AI Panel (LEAP), whose published forecasts we cite above. He had no role in the design, analysis, or writing of those reports.